Submissions: how to view registration form answers - Webinar
On the submissions tab of the registration form, you will be able to see all answers submitted from attendees or applicants.
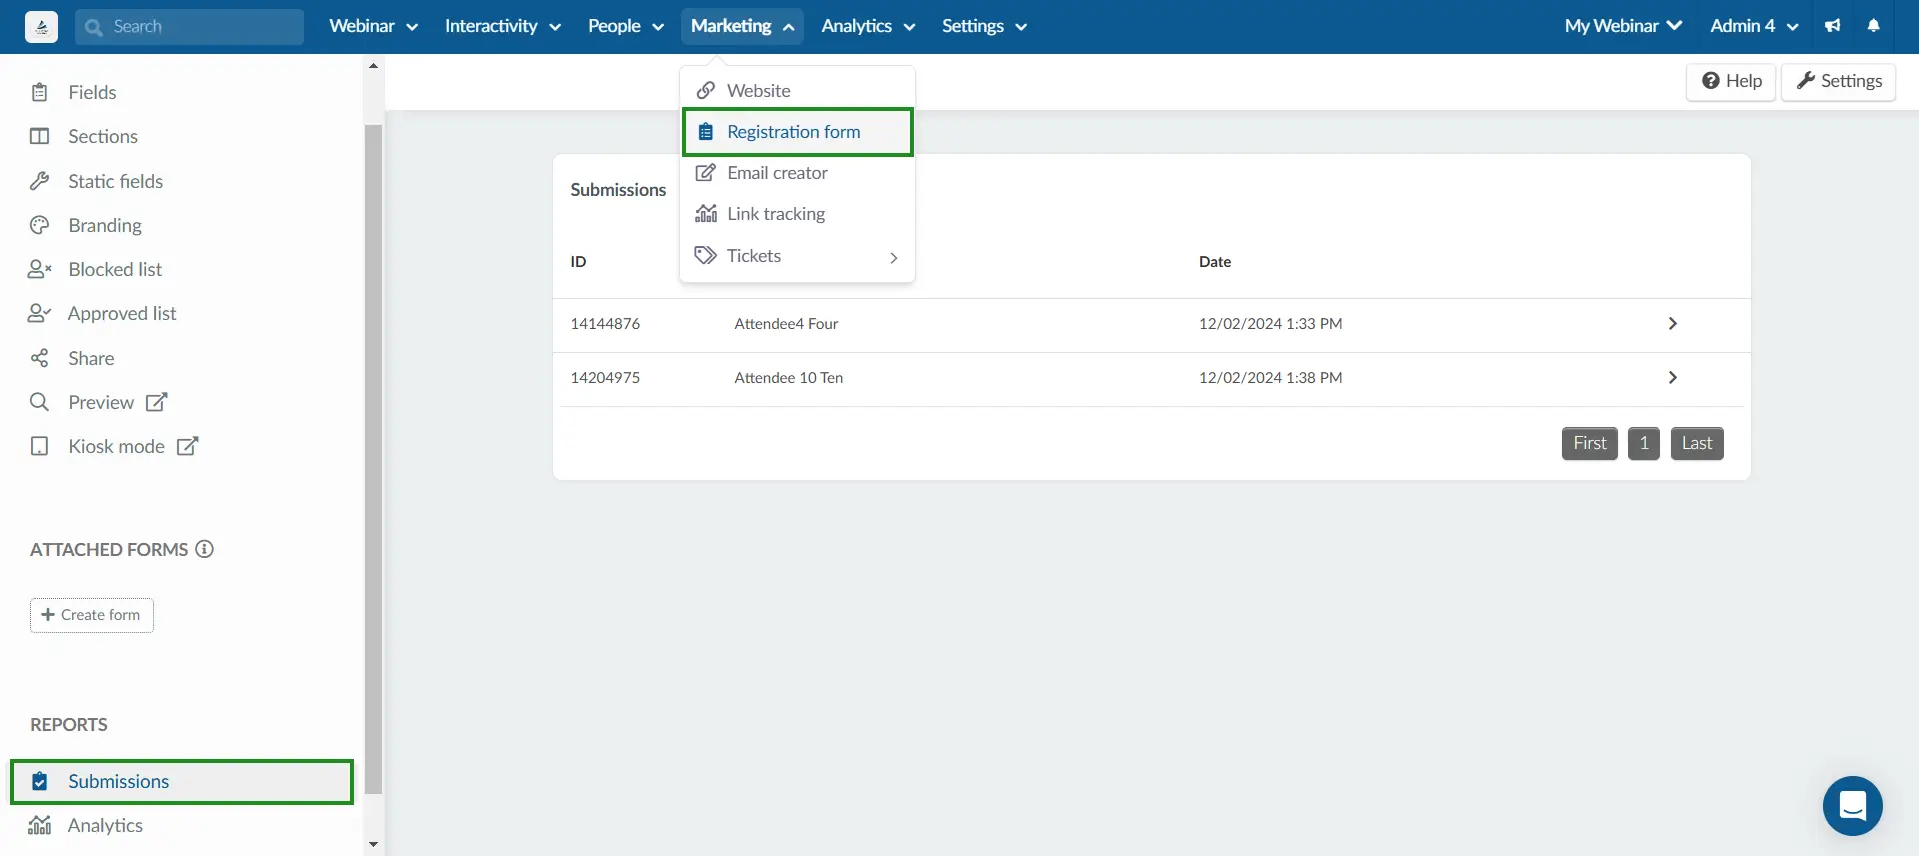
Accessing the registration form submissions
To view the submissions of registration form questions, go to Marketing > Registration > Registration form and press the Submissions tab under Reports.
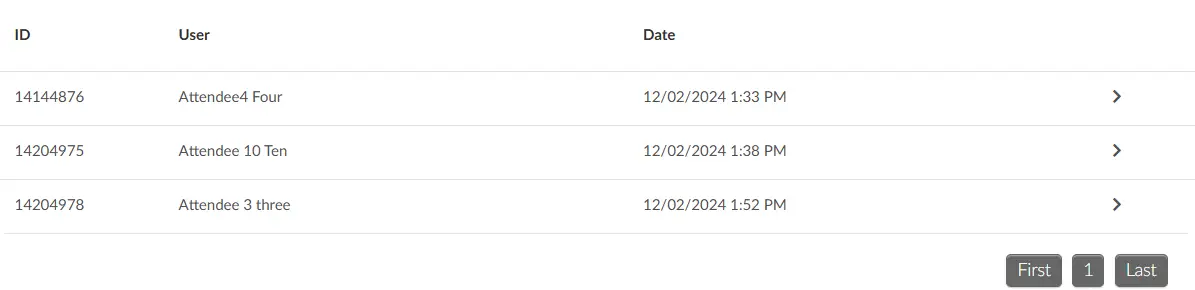
Viewing all answers per attendee or applicant
To view all answers per attendee or applicant, on the submissions page, click on the name of the user whose registration information you would like to view, as shown below:
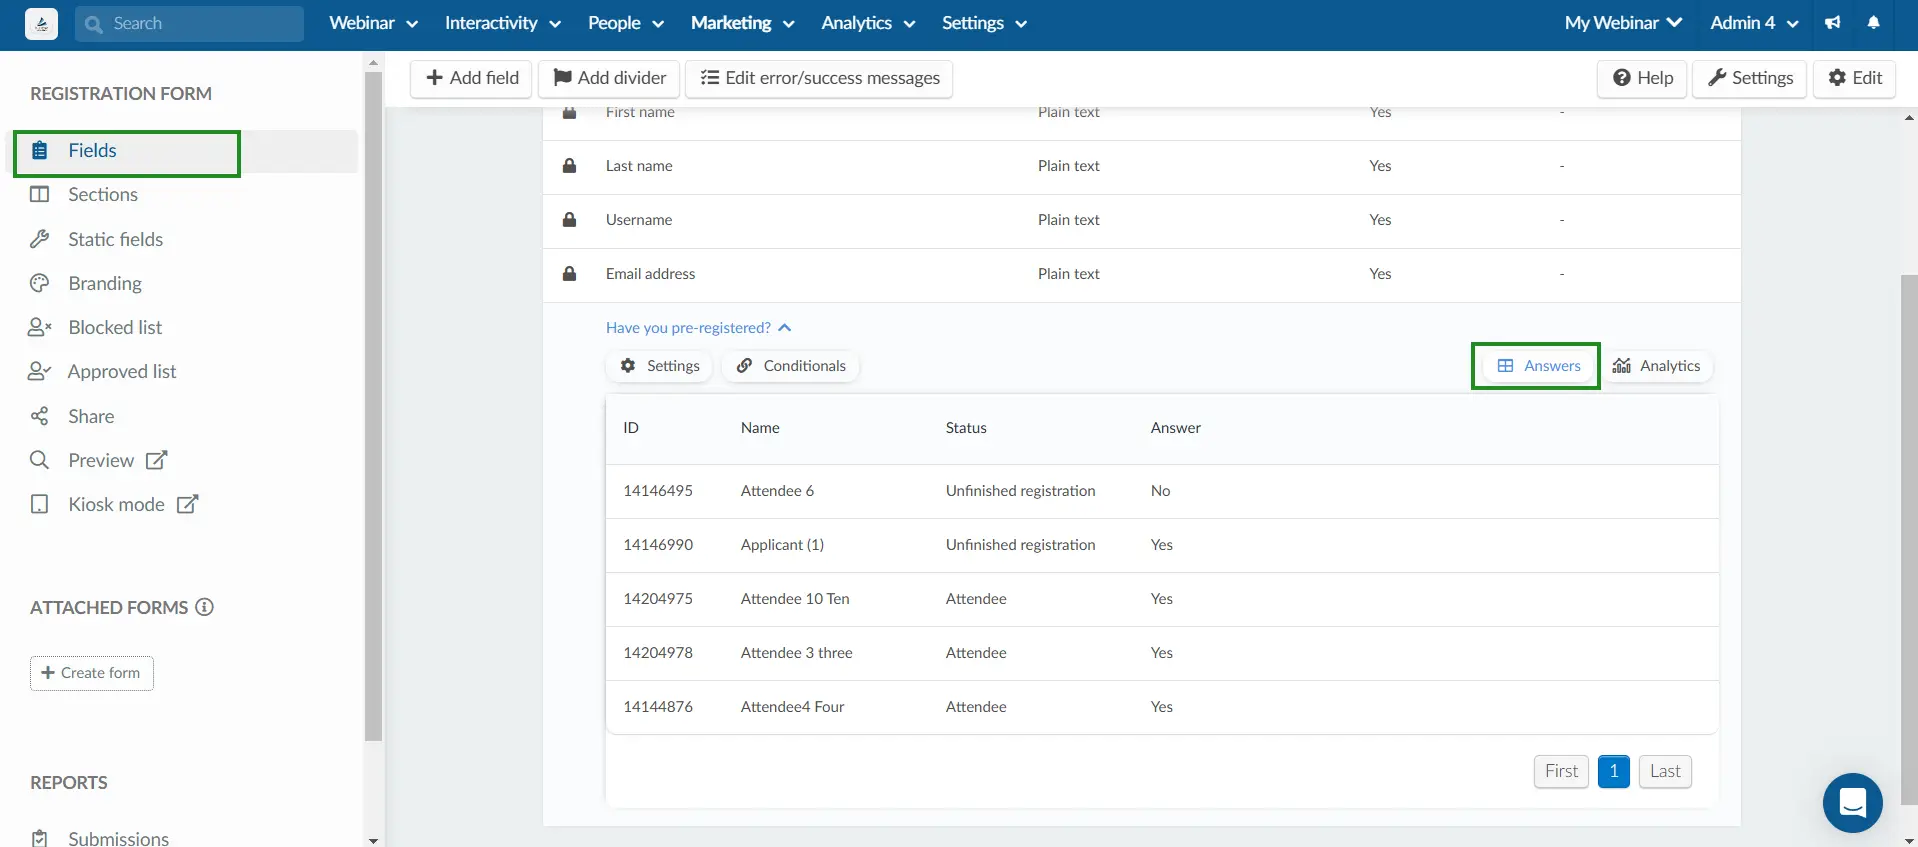
Viewing all answers per question
To view the answers given per question, click on the Fields tab, click on a question and press the Answers button towards the right corner.
Analytics
You can also view the analytics with a pie and bar chart, for certain answer types, such as:
- Yes or No
- Grade 0 to 5
- Options List
- Multiple Choice
To view the analytics of a specific question, click on the Fields tab, click on a question and press the Analytics button towards the right corner.
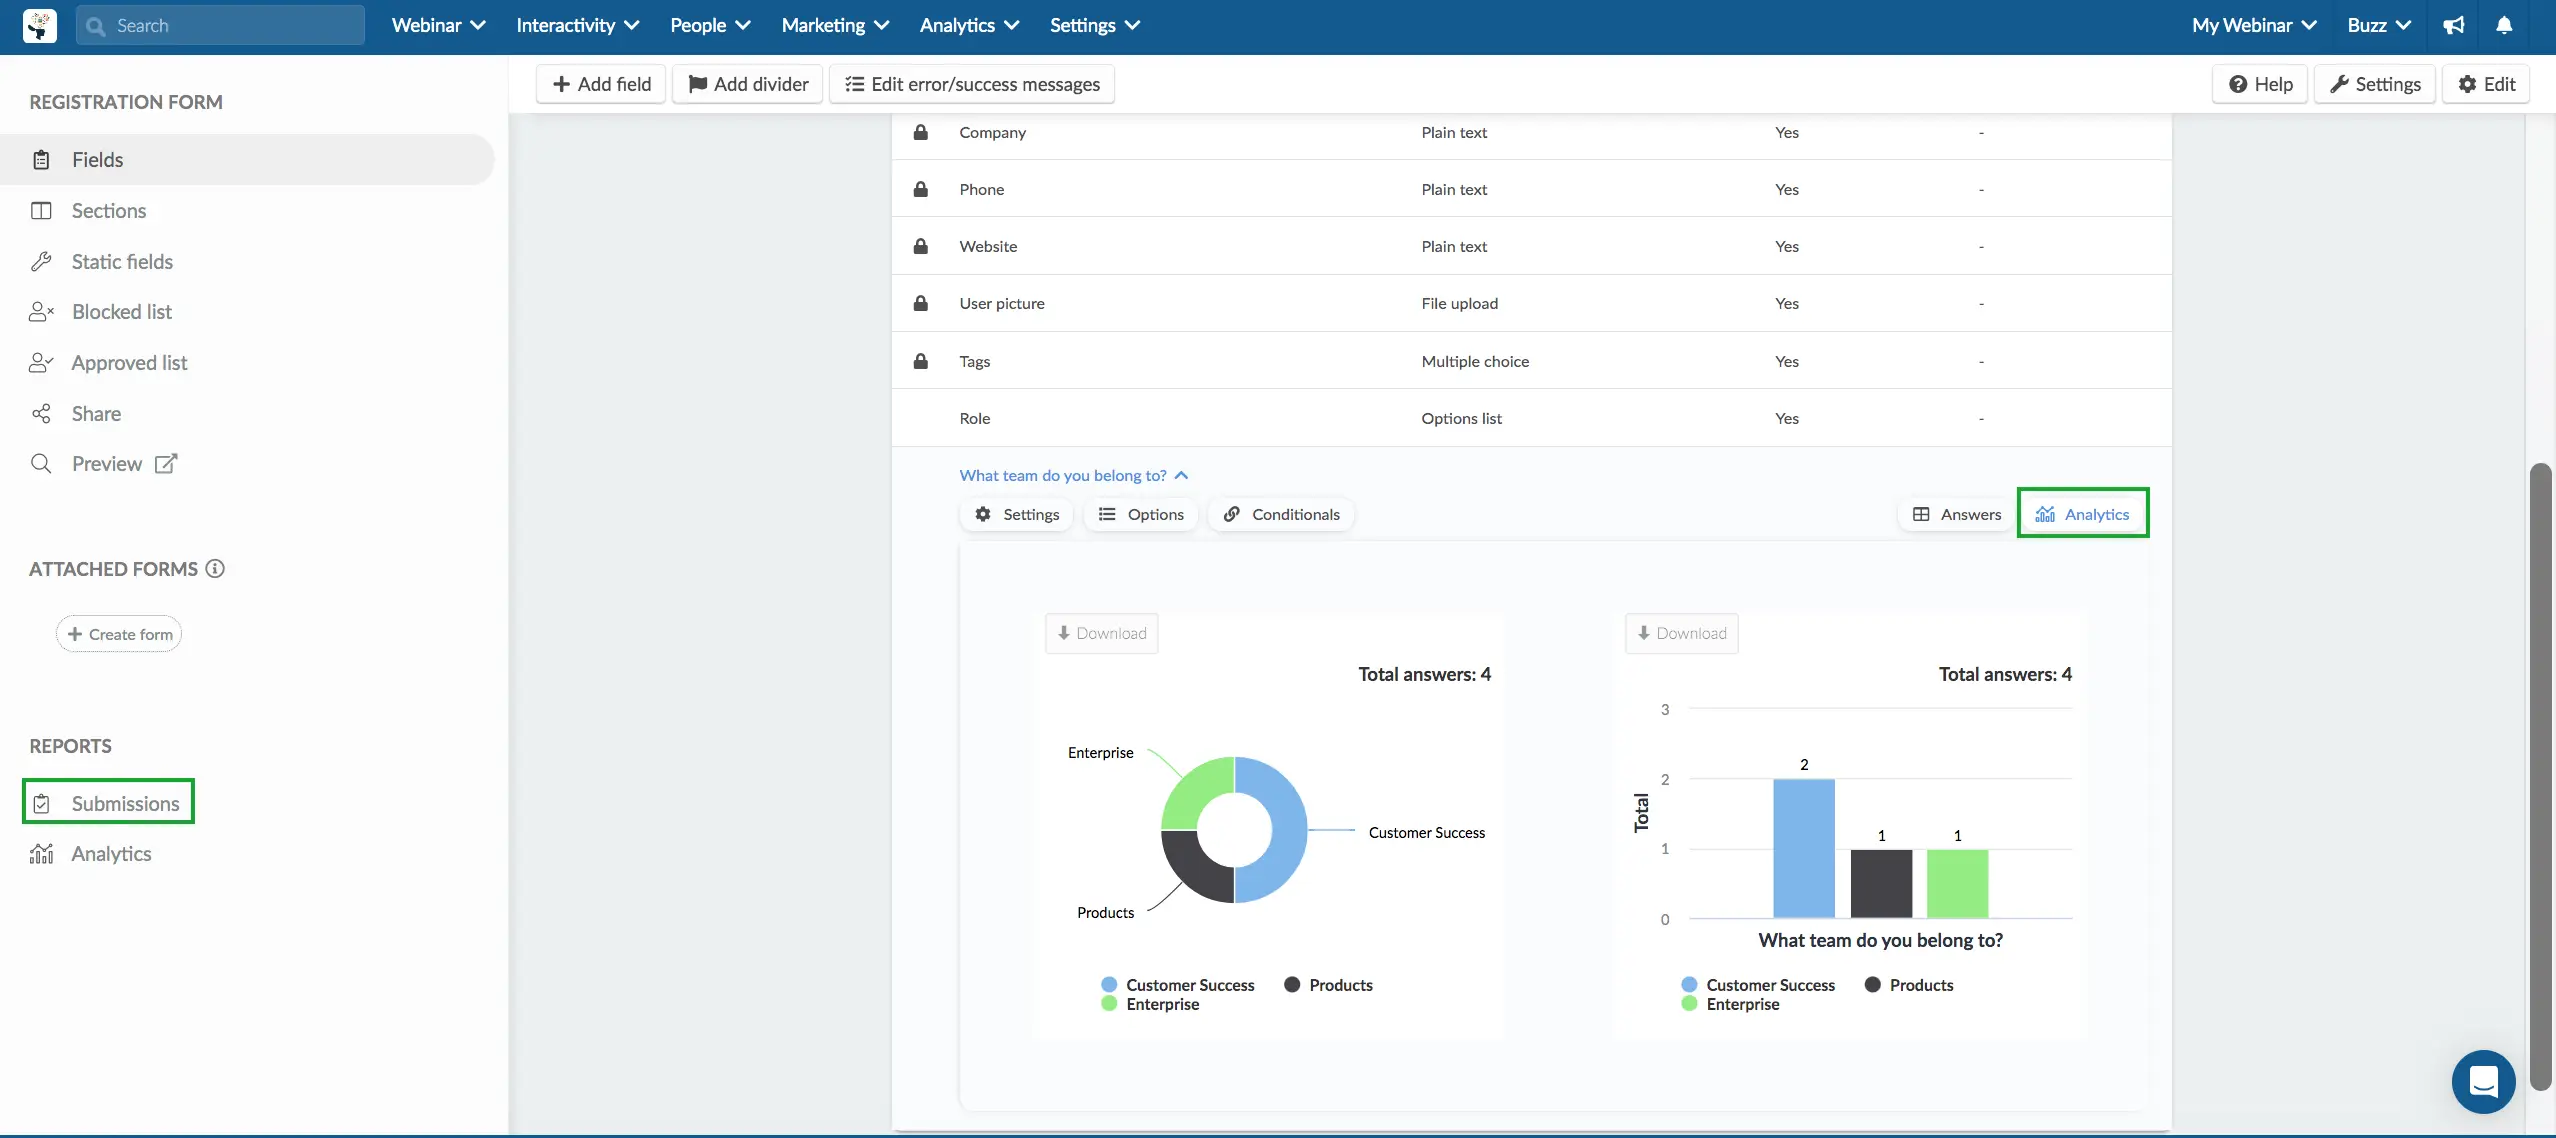
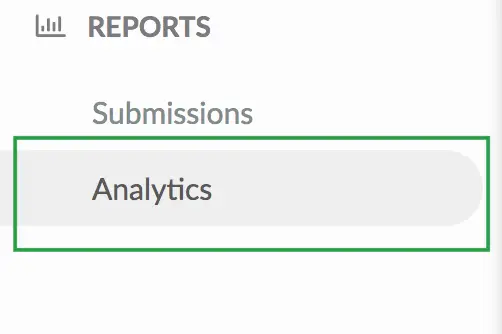
It’s also possible to view the answers to all questions all at once. To do so, you'll need to access the Analytics of the form submissions by clicking on the Analytics tab under Reports on the bottom left corner.
You can either press Analytics, to visualize the form submissions in a graphic format, or Answers, to visualize the form submissions in a listing format.

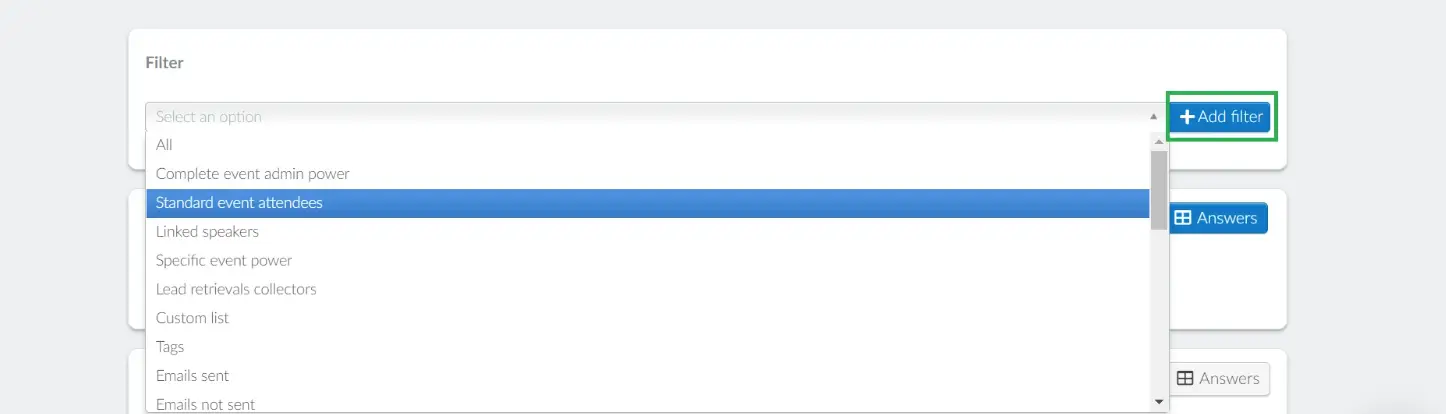
You will have the possibility to filter these submissions using several options, such as: linked speakers, tags, standard event attendees, attendee present online, among others. Once you choose the desired option, click on the blue button +Add Filter.
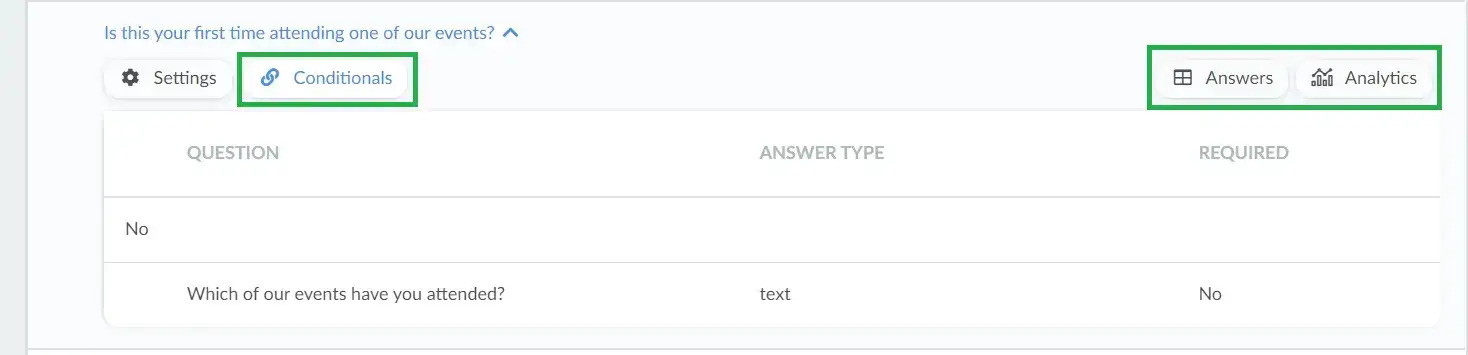
Conditionals
You also have the option to view the answers to the conditional fields or questions by clicking on the Fields tab, then pressing Conditionals > Answers.
To view the analytics of a specific conditional field or question, press the Analytics button towards the right corner.
Click here for further information on conditional fields.
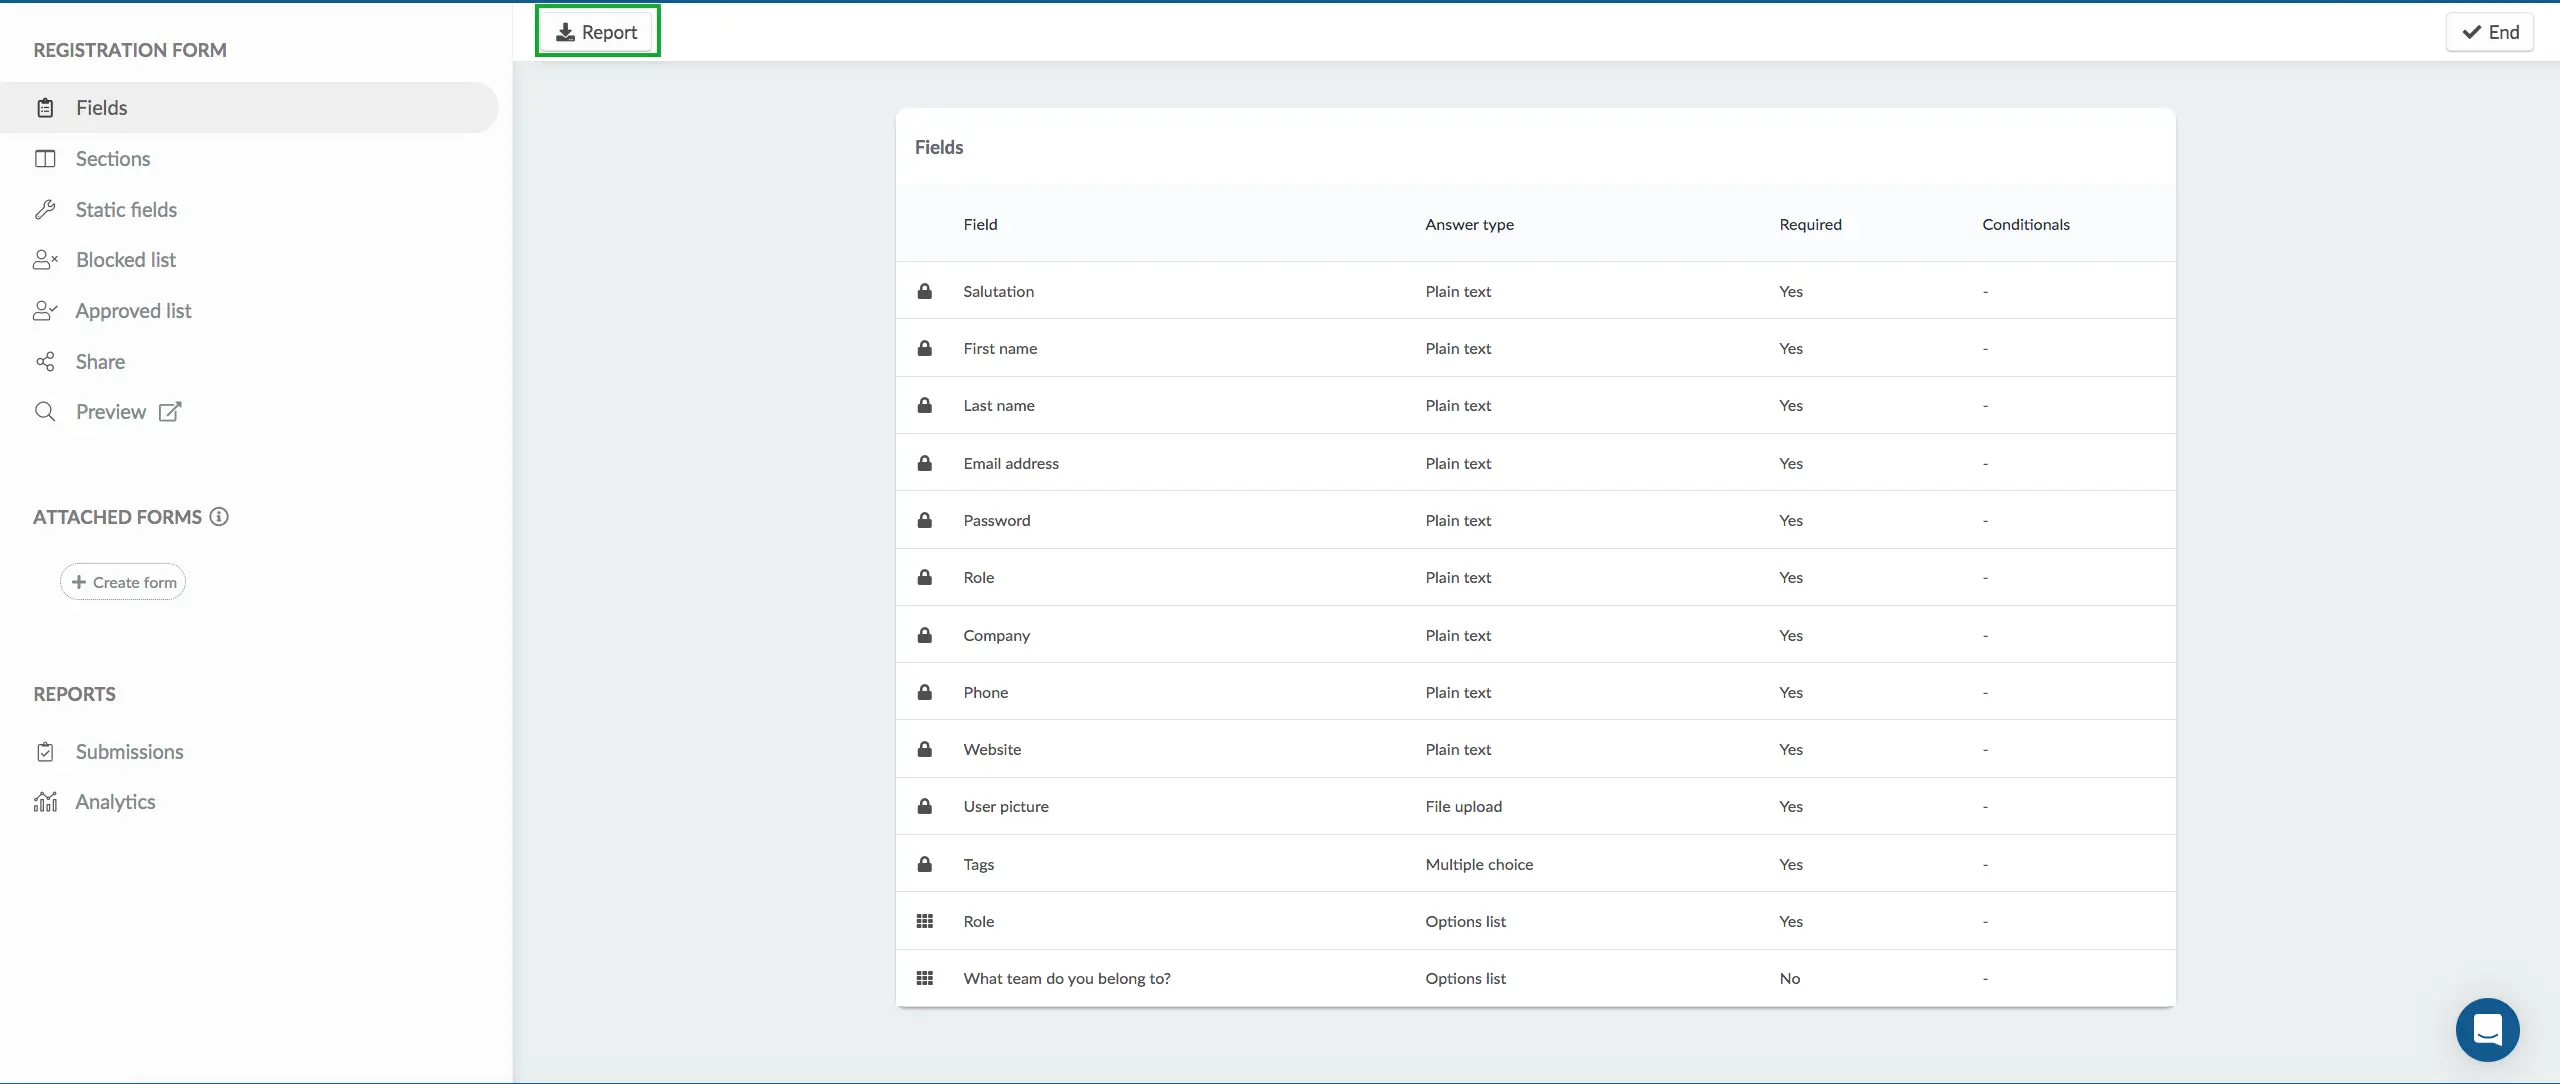
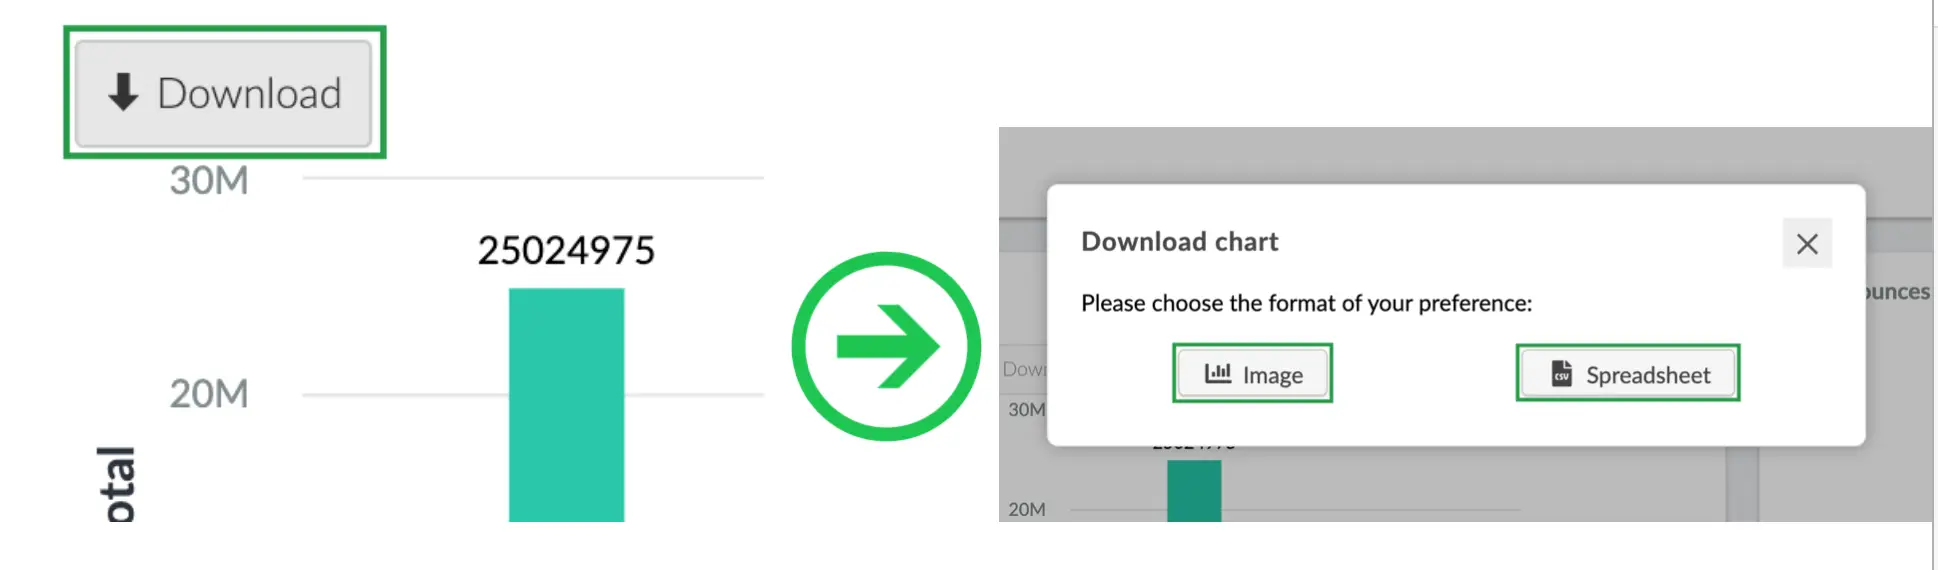
Reporting form submissions
To have this information available in an excel sheet, press Edit > Report. Once you click the button, a message will appear at the top of the screen warning you that you will receive the file with the data in your email when the process is complete.