Live Analytics
 Updated 11 months ago
by
Amalia
Updated 11 months ago
by
Amalia
Track various types of event related information and controls in real-time. This feature provides essential data to support decision-making and process improvement. Additionally, it enables the analysis of ROI, post-event information, and more!
How do I enable/disable this option?
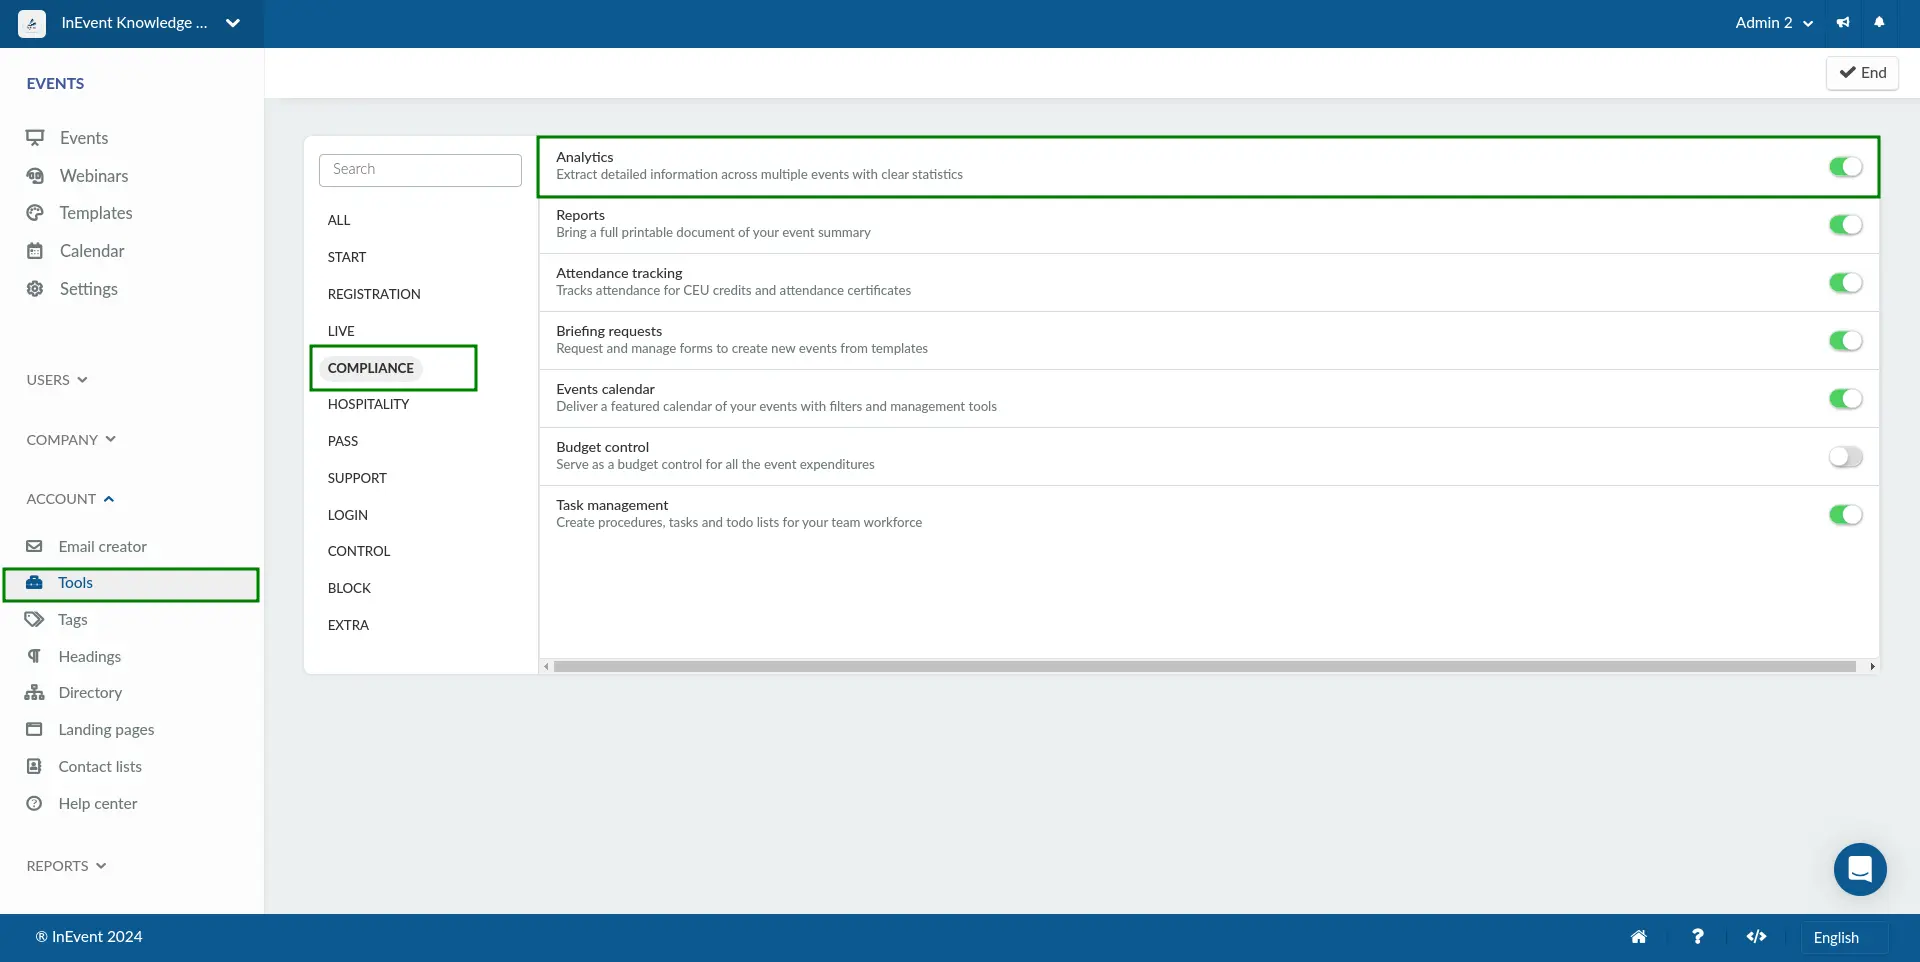
First of all, you should check if this functionality is enabled to be consulted. To do this, access the company level, and go to Account > Tools. Then search for Analytics, and under the Compliance section, click on Edit > mark the checkbox to enable it, or uncheck the box to disable it > click on End.
How do I access the Live Dashboard?
At the event level, you can access the event information by clicking on Analytics and then select Live Dashboard.
See the Virtual Lobby and app accesses during the event, beacons information, and activity-related questions.
Live Dashboard Menu
To navigate through the Analytics/Reports, use the menu on the left side as outlined in the image below.
- Event - This shows you an overall analytic view of your event.
- Engagement score- shows the general engagement during the event.
- Feed - Shows the posts and overall engagement in the event.
- Admin - Shows data from all admins and their individual ranking.
- Users - Shows data from all users and their interactions.
- Connections - Spider web connection screen that shows the interactions between attendees.
- Leaderboard - Shows ranking of the most engaged attendees, according to their interaction in the event, including the event admins.
- Tickets - Shows ticket related analytics when the Ticket and Ticket requirement tools are enabled
- Sponsors - This shows an overview of views and clicks on sponsors.
- Ads - Shows the number of views and clicks each Advertisement has received.
- Data Collector - Shows the data collected on each sponsor.
- Activities - Shows a statistical overview of interactions in the activities.
- Feedback - Shows feedback answers in each activity.
- Questions - Shows questions in each activity.
- Forum - Shows comments in each activity.
- Polls - Show polls answers in each activity.
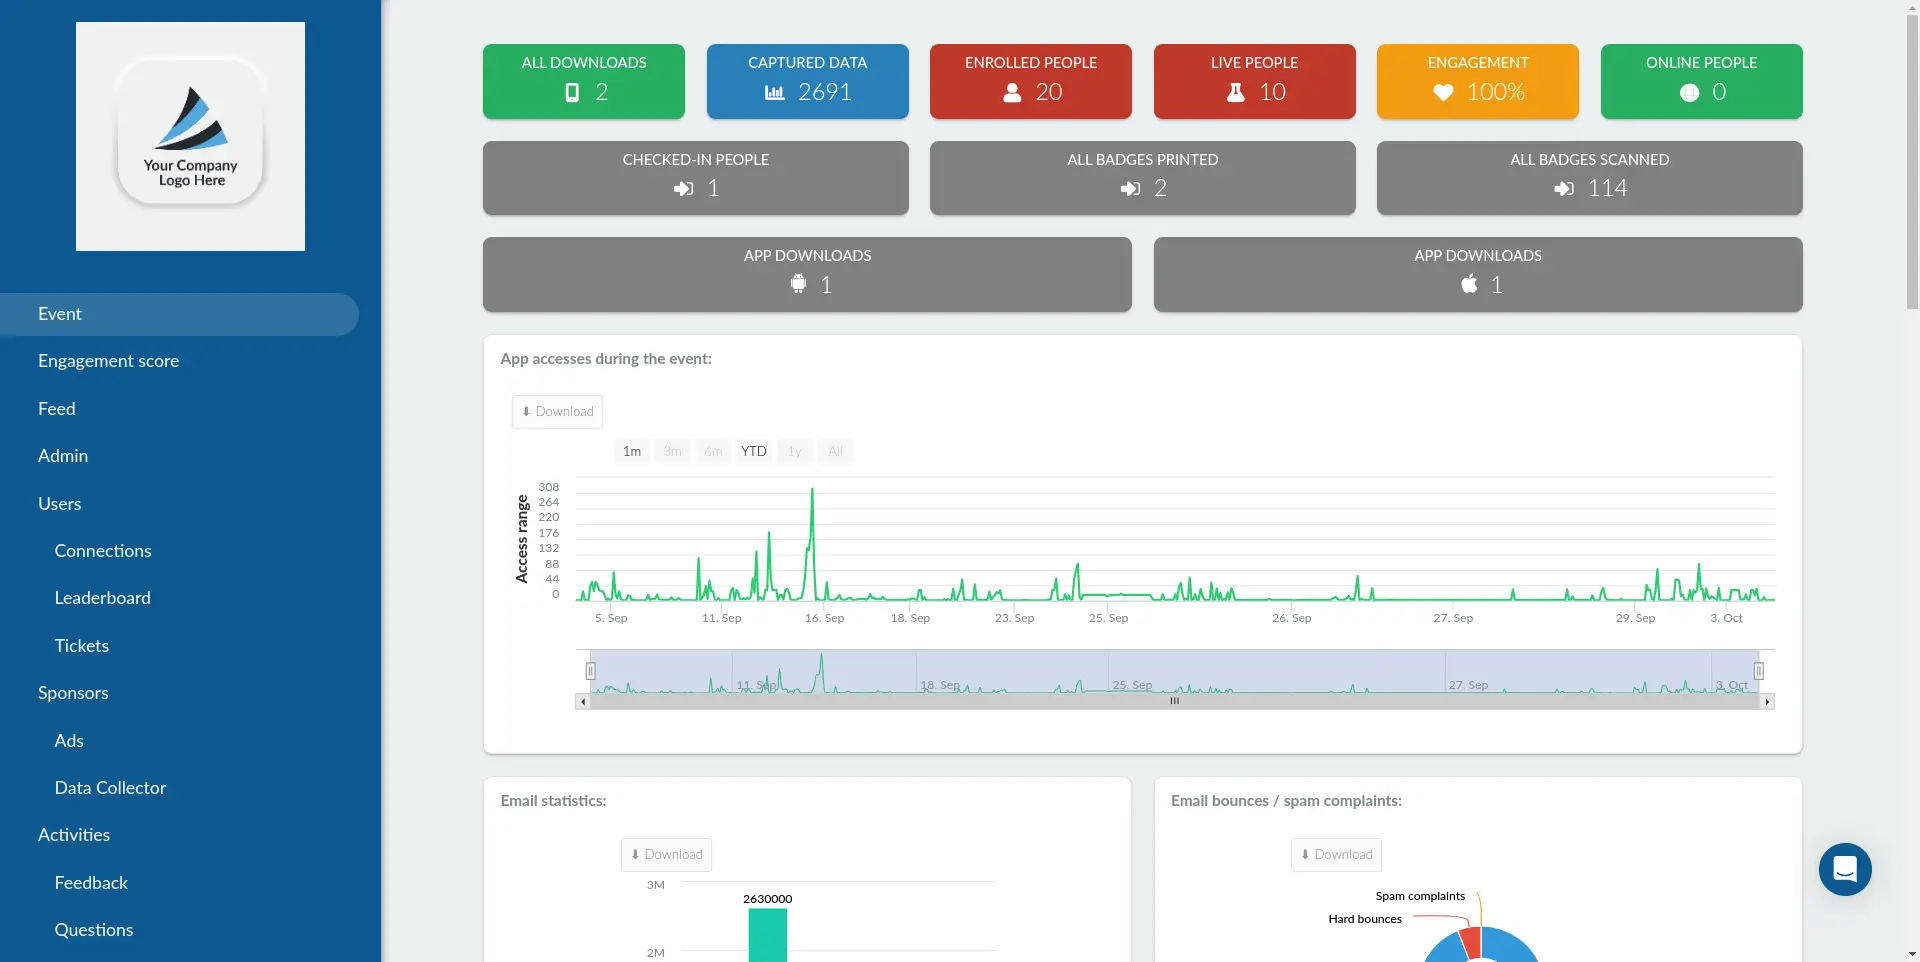
Event Screen Overview
The Event analytics summary screen will provide you a summary of live and general attendee data.
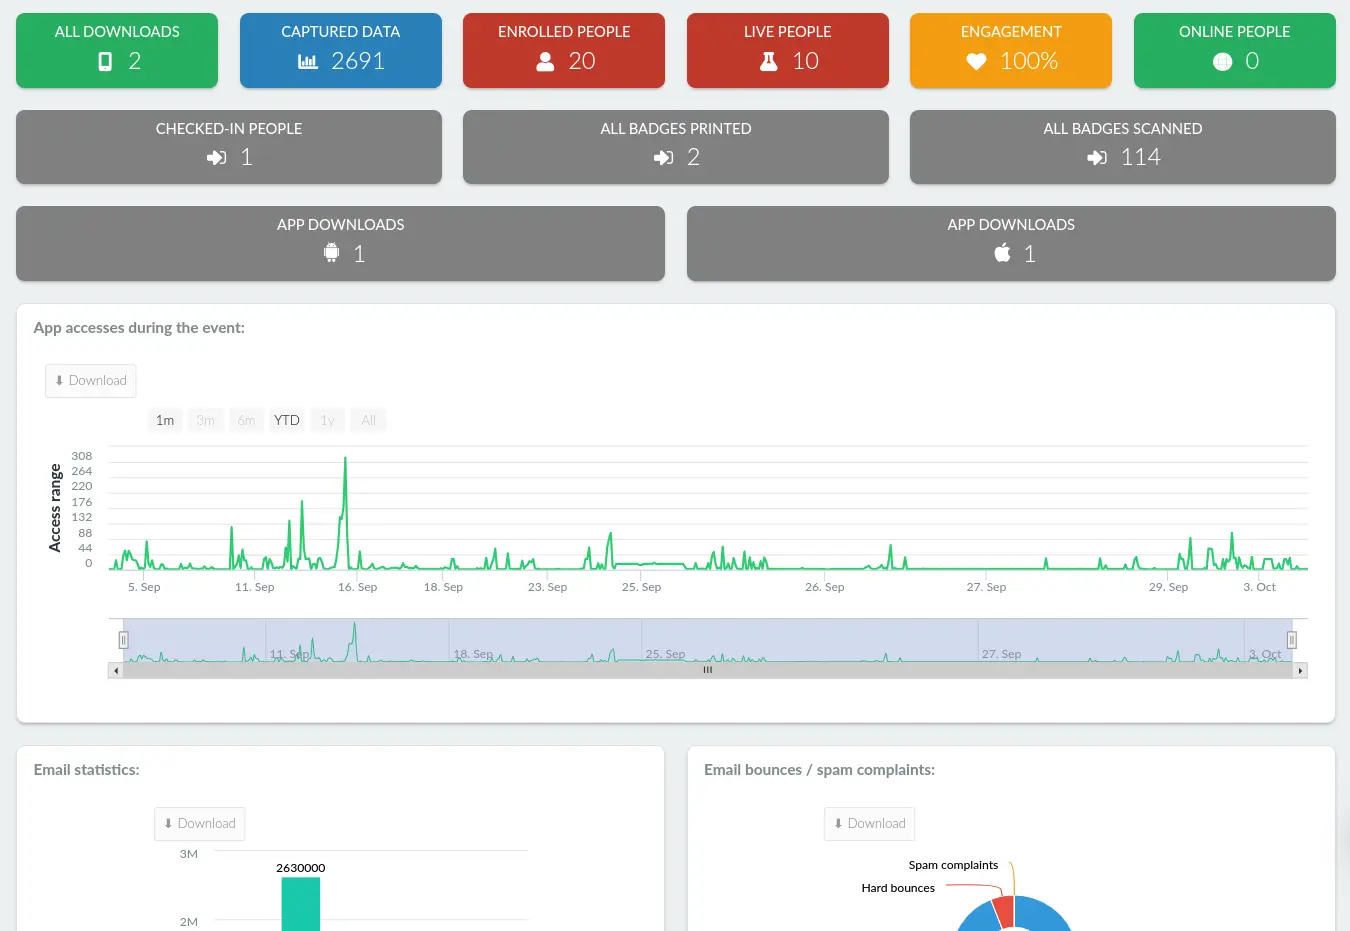
The fields you will see in the summary section are:
- All Downloads - the total number of app downloads.
- Captured Data - the total amount of inputs given to our platform by the attendees. It counts for example the number of page views, clicks, interactions (chat messages sent, questions sent), etc.
- Enrolled Peopled - how many people are enrolled in the event, they appear under People >Attendees.
- Live People - how many are currently logged into the App.
- Engagement - This value is calculated based on past reports and on InEvent successful cases. The engagement is calculated as Captured data / Number of users. It basically relates Virtual Lobby and app collected data with the number of enrolled people.
- Online People - number of logged-in users accessing the website right now.
- Confirmed People - attendees that have confirmed they will attend the event (RSVP = yes).
- Checked-In People - attendees that are currently checked-in to the event using accreditation (ie. QR Code or NFC) and have not checked out.
- All badges printed - the number of physical badges that have been printed.
- All badges scanned - the number of QR codes scanned.
- App download - number of app downloads by device type (iOS or Android).
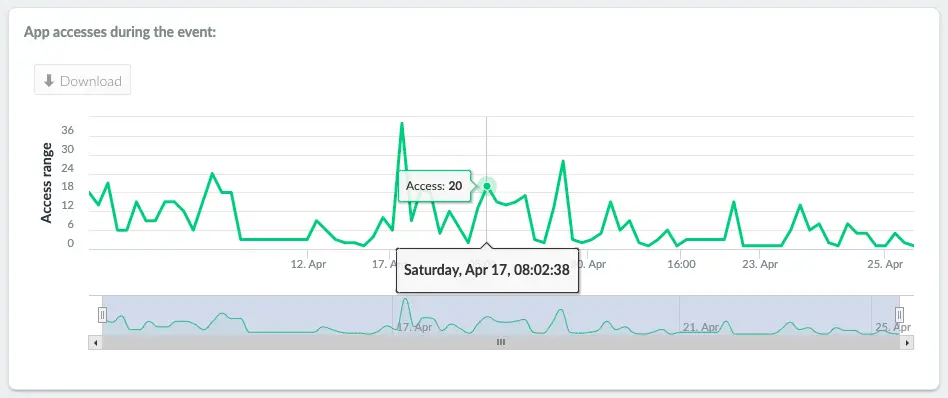
- App access during the event - This graphic displays the number of times attendees accessed the event at specific points of time, on the Virtual Lobby, and while using the app.
- Email statistics
Email statistics provide information about your:
Quota - number of emails available in the company to send.
Sent - number of emails sent at this event.
Opened - number of emails opened by attendees or leads for this event.
Link clicks - number of links clicked within opened emails for this event.
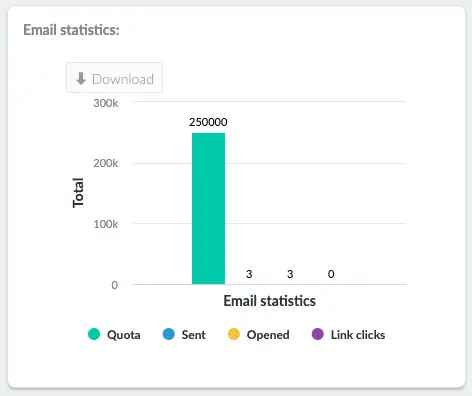
For further information regarding email analytics click here.
- Email bounces / Spam Complaints
It provides information about the emails of the event:
Clean emails - emails delivered without issue.
Hard bounces - emails that were not able to be delivered due to incorrect addresses or non-existent domains.
Spam complaints - emails marked as spam by the receiving party or their email provider or spam solution.
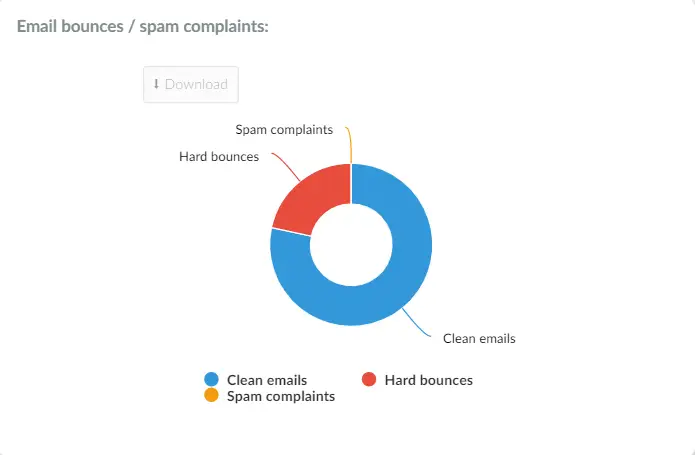
Click here to learn about email health.
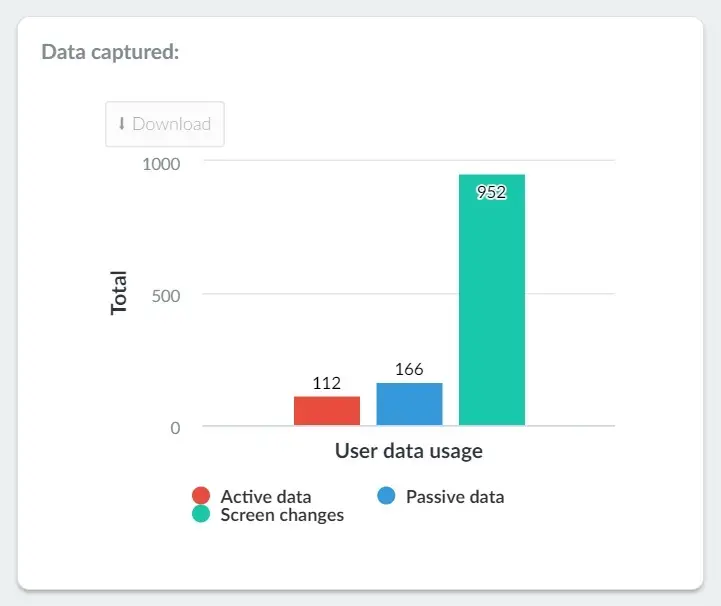
- Data captured
Active - the data provided by the user: when voting in polling, send a question, etc
Passive - user data captured automatically such as operating system data of the phone: authorizing the notifications, the access to the camera, etc
Screen changes - the number of time users interacts by changing screens
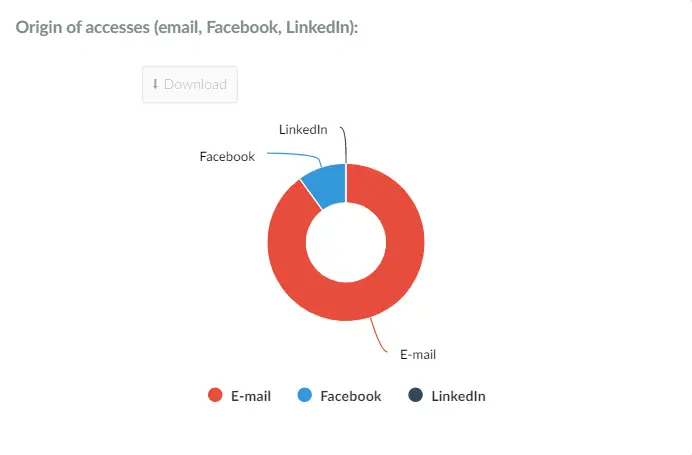
- Origin of access
It will show where the traffic came from, i.e. Facebook, LinkedIn, or email.
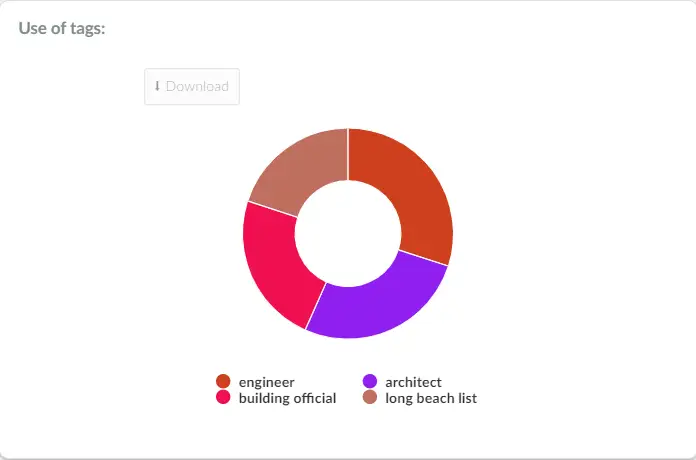
- Usage of tags
Tag data points. It will also display the percentage for the attendees' tag.
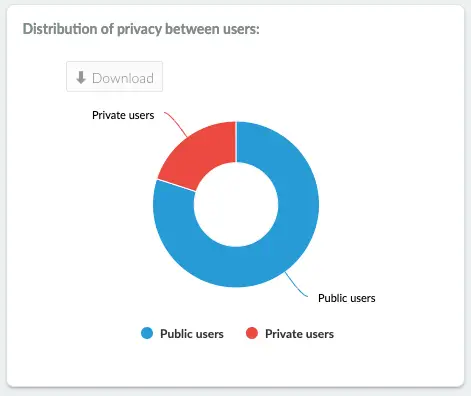
- Distribution of privacy between users
Users that have chosen to note share their profiles with other users (private accounts) and public accounts (sharing with other users of the event). Check this article to learn about the attendees' visibility.
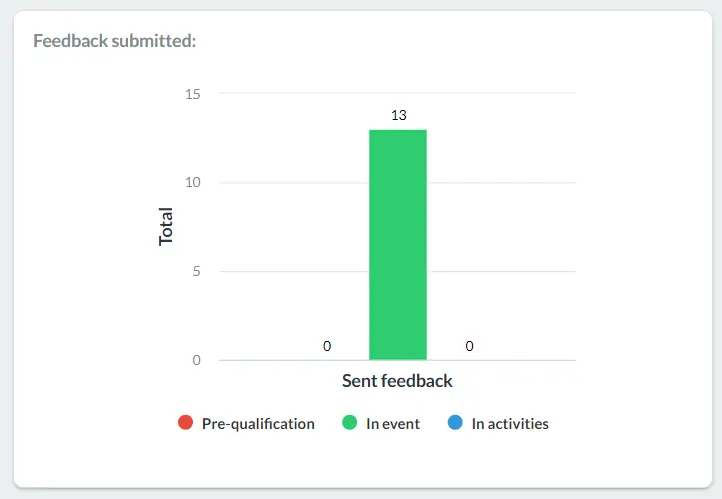
- Feedback submitted
Attendee-generated feedback.
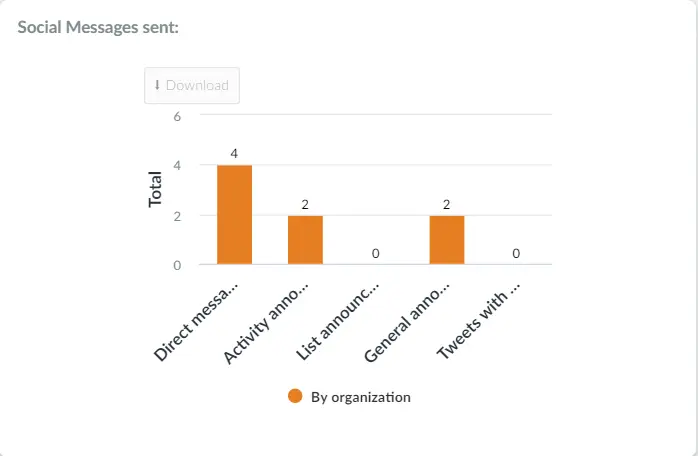
- Social Messages Sent
Direct Messages - private messages sent to attendees
Activity announcements - messages sent in activities
List announcements - messages sent to lists
General announcements - messages to all attendees
Tweets with a hashtag - number of tweets with the registered hashtag
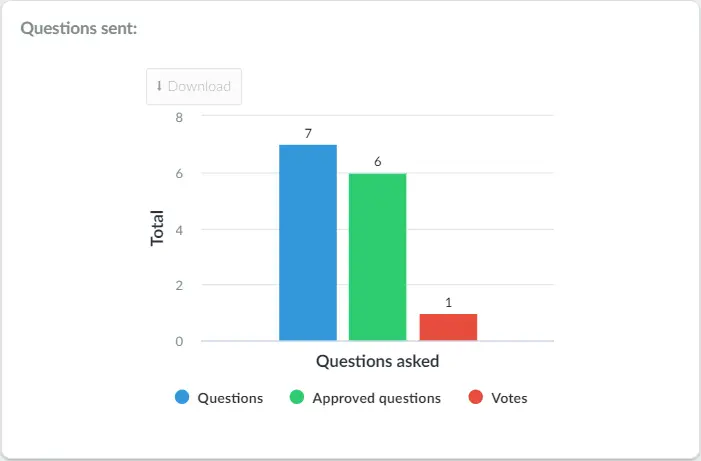
- Questions sent
The number of questions sent by attendees.
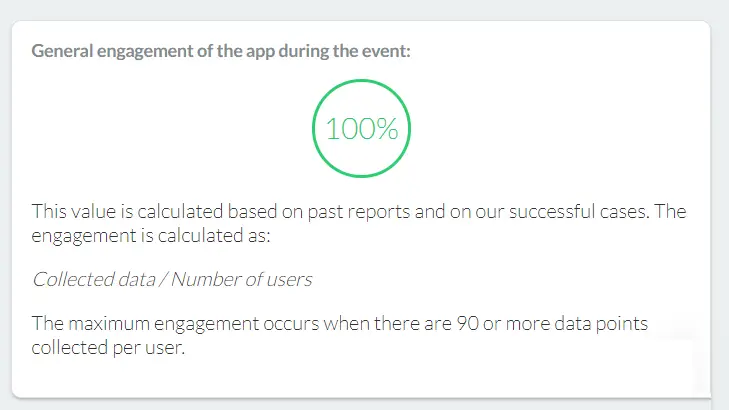
- General engagement of the app during the event
This value is calculated based on past reports and on our successful cases. The engagement is calculated as Collected data / Number of users.
The maximum engagement occurs when there are 90 or more data points collected per user.
Feed screen overview
Information regarding the news feed of the event:
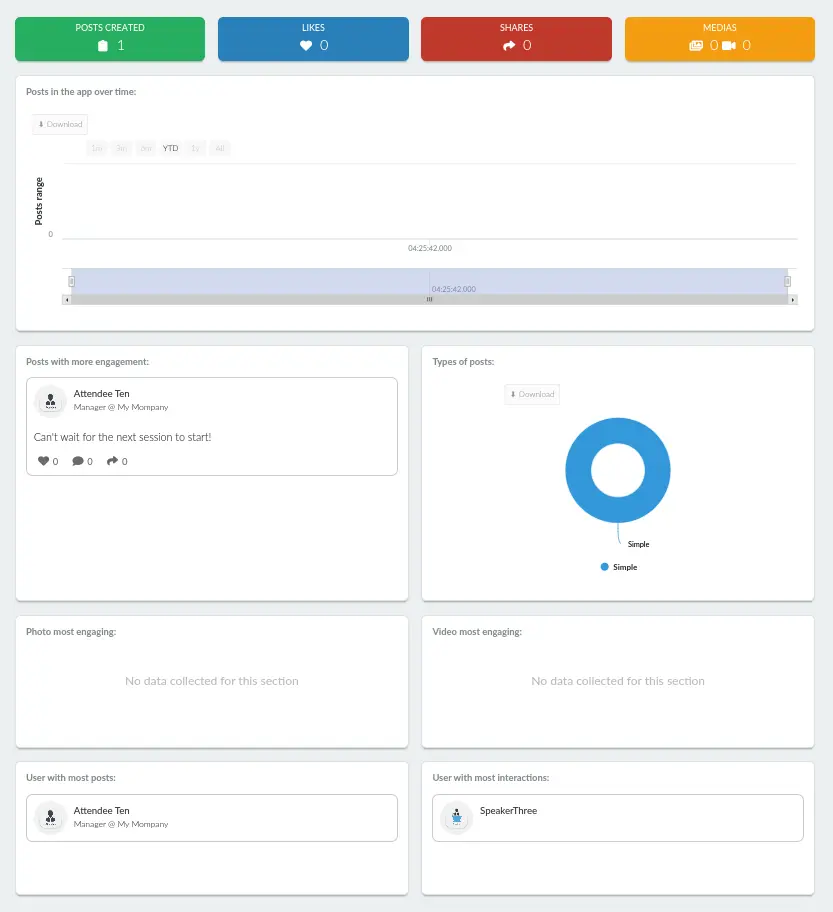
- Posts created: How many posts were created by people in the event.
- Likes: How many likes are given on all posts
- Shares: How many posts have been shared
- Media: How many images, gifs, or videos have been uploaded to the feed
- Posts in the app over time: This shows the YTD information of all posts made by people on the app. The graph contains a slider that allows you filter the information through the dates. The graph can also be downloaded as an image or as a spreadsheet.
- Posts with more engagement: Shows the post that has the highest engagement level from people in the event.
- Types of posts: Shows a pie chart of the different social platforms a post came from.
- Photo most engaging: Shows the most engaging picture posted on the feed.
- Video most engaging: Shows the most engaging video posted on the feed.
- User with most posts: Shows the user with the most amount of posts on the feed.
- User with most interactions: Shows the user whose post has had the most interaction- likes, shares etc.
Engagement score overview
Here, you can monitor attendee engagement in your sessions, including statistics on attendance, poll responses, quiz responses, question responses, and chat interactions. The engagement is calculated as Collected data/Number of users.
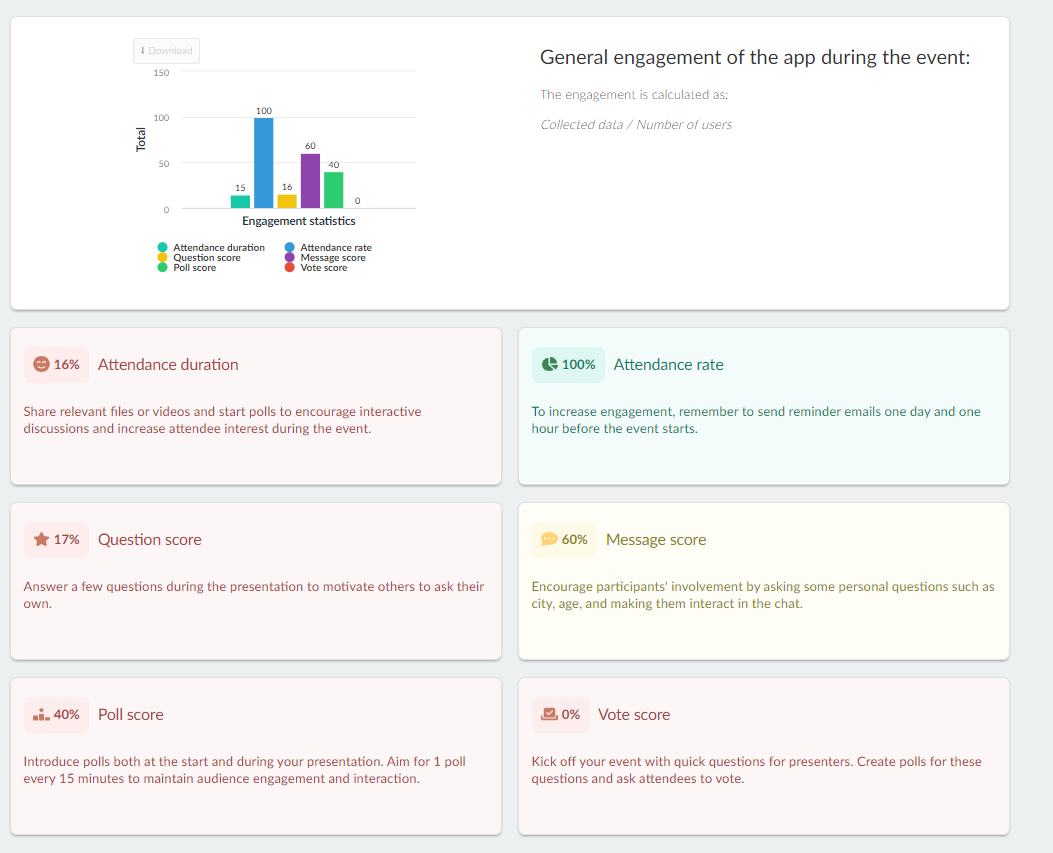
- Attendance duration: Shows the percentage of the total session time that attendees have spent in the event. It indicates how long attendees remained engaged in sessions relative to the total event duration.
- Attendance rate: Shows the percentage of attendees who participated in the event by joining at least one activity session, relative to the total number of registered attendees at the event. It is calculated using the formula: Number of attendees who joined an activity / Total number of registered attendees ×100.
- Question score: Shows the percentage of total attendee questions answered across all activity sessions in an event. It is calculated using the formula: Total number of questions answered /Total number of questions asked ×100.
- Message score: Shows the percentage of attendees who sent chat messages across all activity sessions. It is calculated using the formula: Number of attendees who sent chats / Total number of attendees in the event ×100.
- Poll score: Indicates the percentage of total poll interactions across all activity sessions from attendees relative to the maximum possible interactions by all attendees. It is calculated using the formula: Total number of poll interactions from attendees / Total possible poll interactions ×100.
- Vote score: Shows the percentage of total quiz interactions across all activity sessions from attendees relative to the maximum possible interactions by all attendees. It is calculated using the formula Total number of quiz interactions / Total possible quiz interactions ×100.
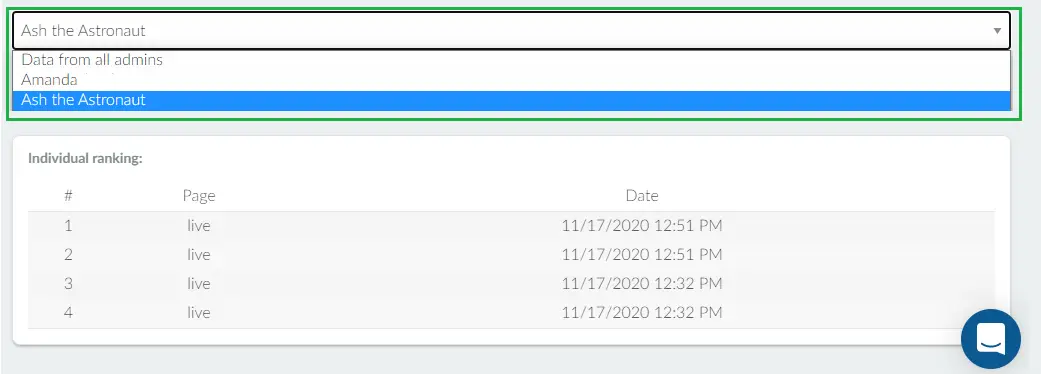
Admin screen overview
Here you can track your administrators, view the most visited pages, and which administrator has engaged the most.
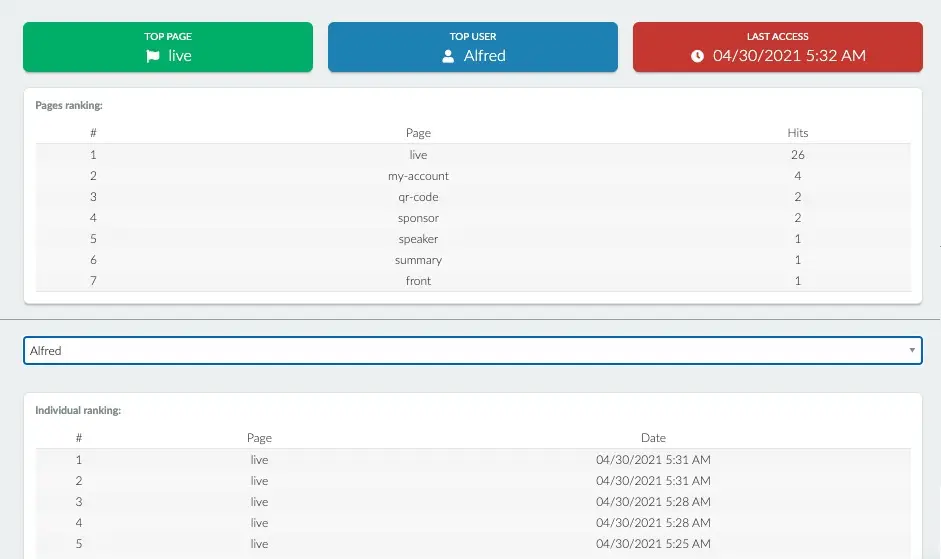
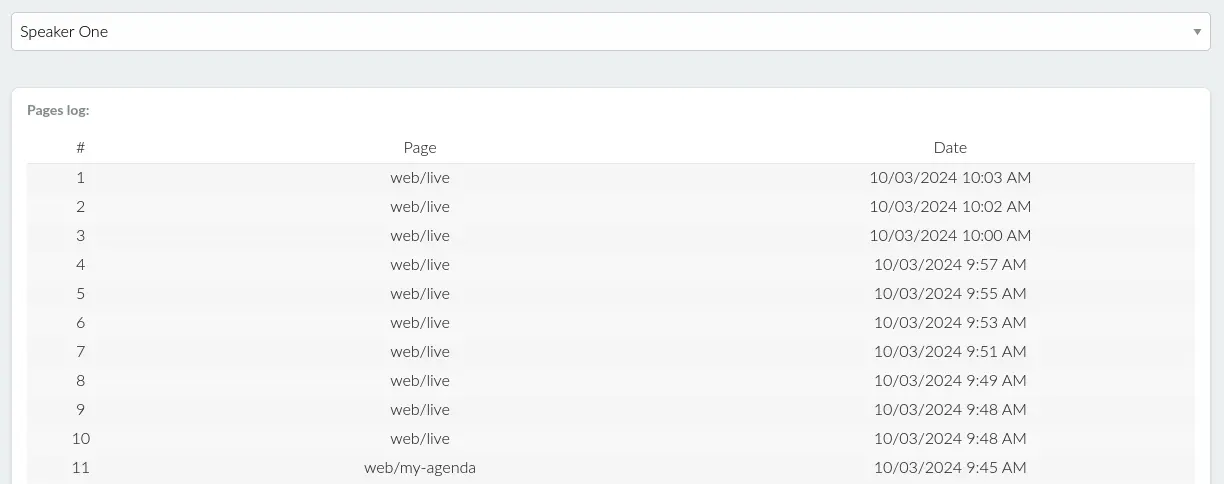
To track the administrators, click on Data from all admins then choose the administrators' name from the drop-down list to view their page navigation throughout the platform, accompanied by dates & times.
Users screen overview
In the users' screen you have an overall look at the networking feature, previewing the stats of synchronized contacts, messages exchanged and total favorites made.
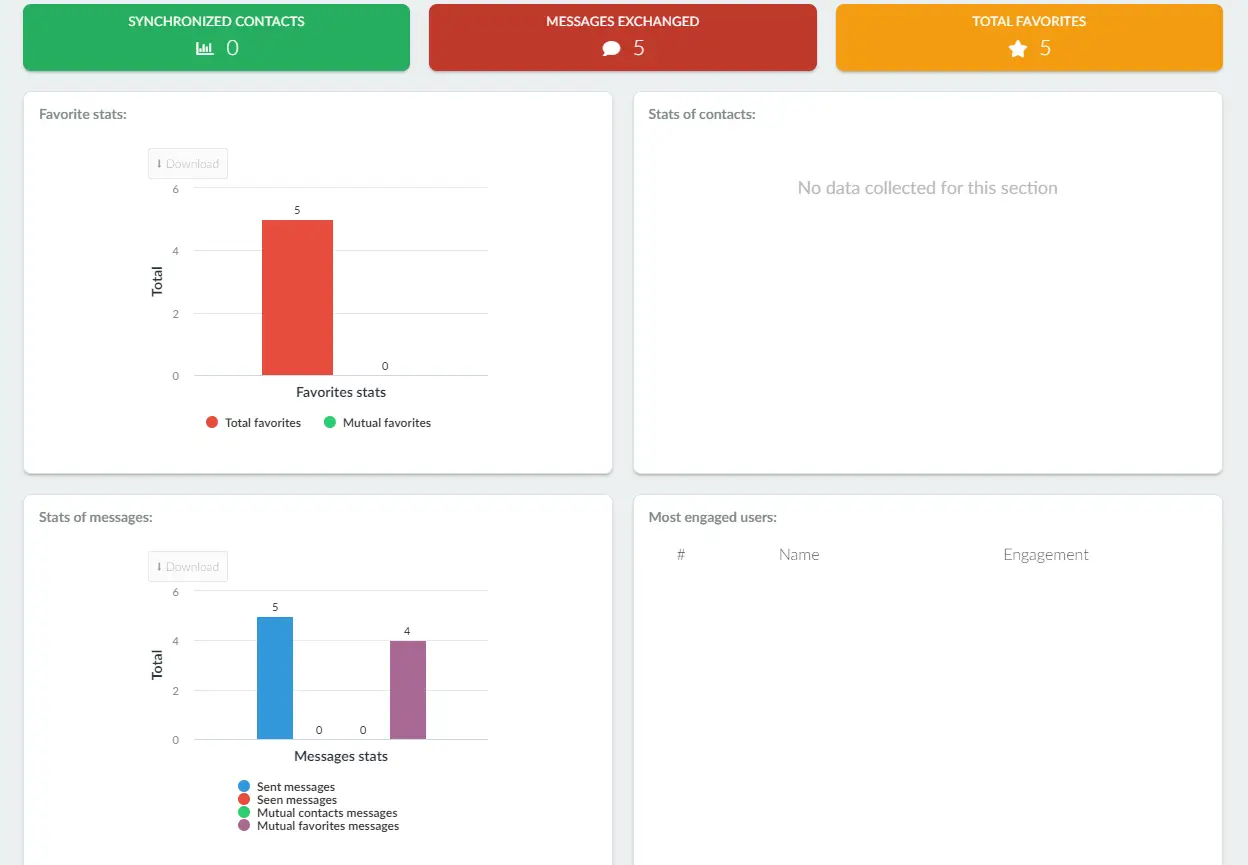
You can view bar charts presenting favorite stats, contact stats, and most engaged users. You can also download these bar charts data in form of an image or a spreadsheet by clicking on the Download button on the bar chart.
The Stats of messages show:
- Sent messages
- Seen messages
- mutual contact messages
- mutual favorites messages
Connection screen overview
Once you interact with a fellow attendee using a networking feature of your event, they will become a connection. The administrator has the ability to view a spider web connection screen to see an overlook of how many connections were made at their event.
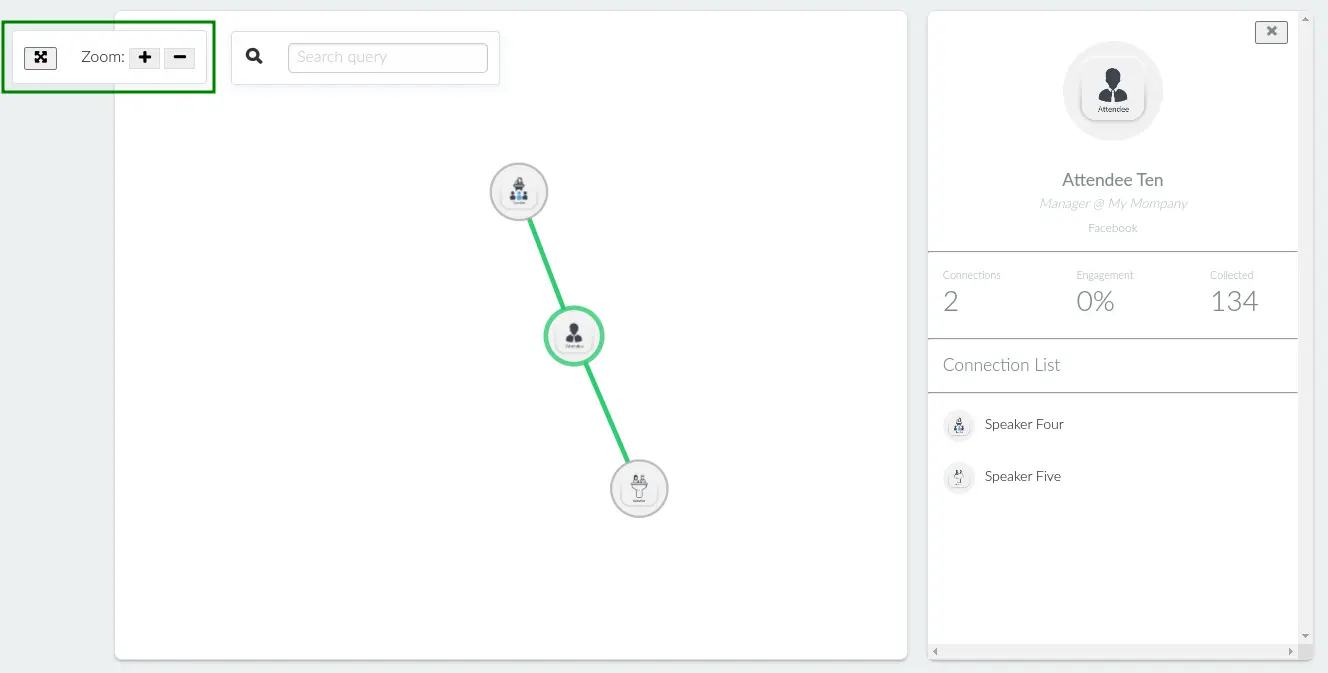
You can use the Zoom function to zoom in (+) or out (-) the connection web. You can also click on each attendee to open the sidebar menu, which lists the number of attendees they have connected with or you can use the Search query box to find information on a user.
Leaderboard screen overview
The leaderboard shows the most engaged attendees using your event app as well as the Virtual Lobby. The percentage is based on the user with the highest number of interactions.
For example, the most engaged attendee is Admin with 53078 interactions (100%), so Admin Four with 9178 interactions will display a percentage of 17%.
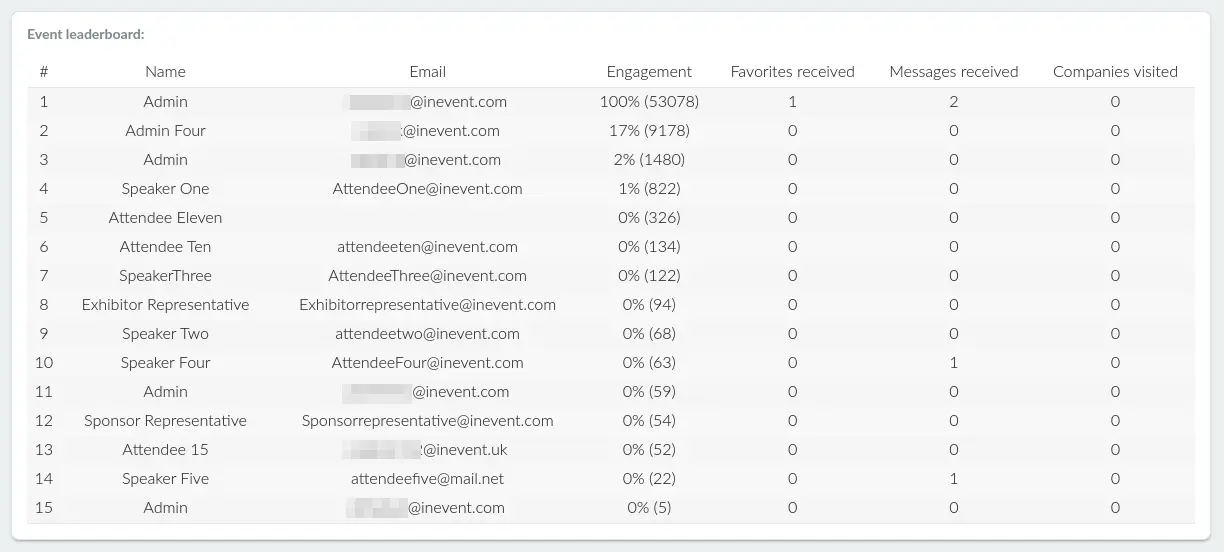
To view each attendee navigated page, click on Data from all users and choose the attendees' names from the drop-down box.
Tickets screen overview
The Tickets section will appear if the Ticket requirement tool has been enabled alongside the Tickets tool. This page will give you a breakdown of ticket related data:
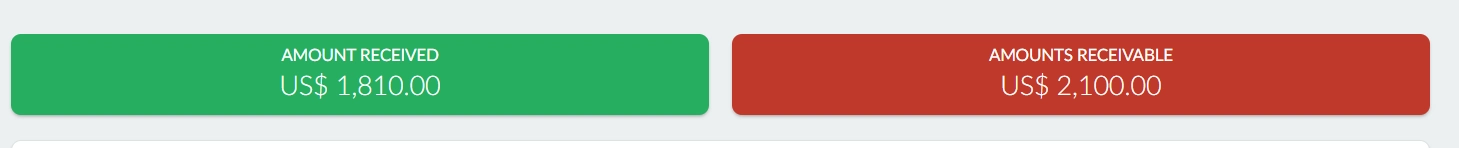
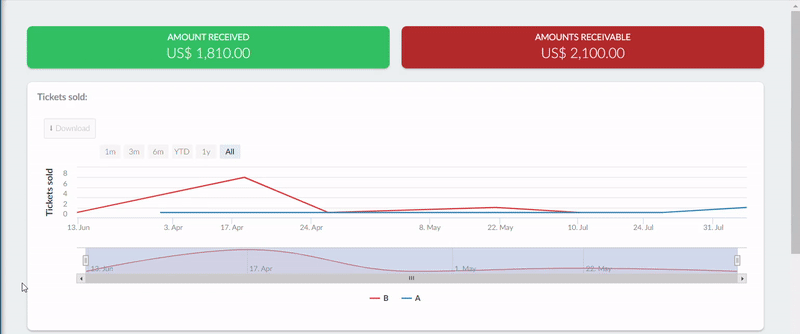
- Amount received: This represents the total amount received from the sales of ticket.
- Amount receivable: This represents the total amount that is expected from the sales of ticket.
- Tickets sold: This graph provides data on tickets sold at your event. Each line in the graph represents the color associated with each ticket type. You can filter the information displayed based on time frames - 1m, 3m, 6m, YTD, 1y or All. Alternatively, you can use the time frame selector to set your preferred time frame.
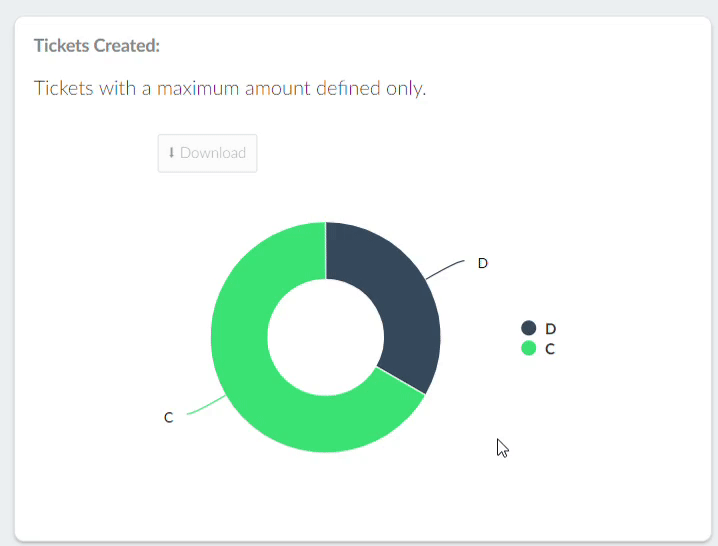
- Tickets created: This pie chart provides data on tickets that have been created for your event. Each ticket type is represented by a different color. When you hover over the chart, you will see the breakdown of the capacity of each ticket along with its percentage. Tickets with larger capacity will occupy a higher percentage of the chart.
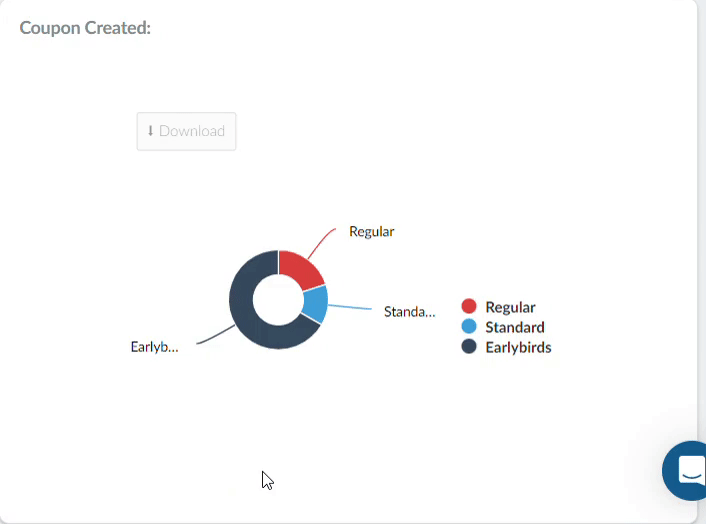
- Coupon created: This pie chart provides data on the coupons created for your event. Each coupon is represented by a different color. When you hover over the chart, you will see the breakdown of the amount created for each coupon and it's percentage. Coupons with larger amounts will occupy a larger portion of the chart.
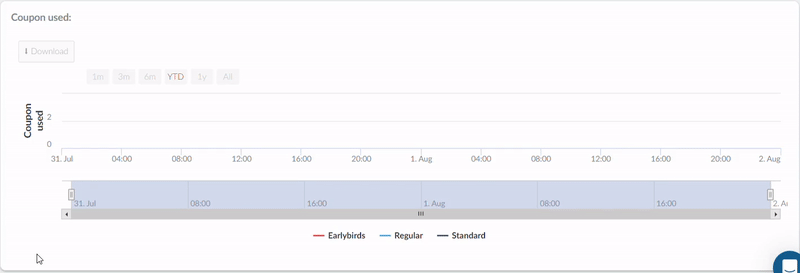
- Coupon used: This graph provides a breakdown of the number of coupons that have been used. Each line in the graph represents the color associated with each ticket type. You can decide to filter the information using the time frame 1m, 3m, 6m, YTD, 1y or All. Alternatively, you can use the time frame selector to set your preferred time range.
Sponsors screen overview
Once you have set up sponsors and exhibitors in your event, you can view their statistics here, to learn more about sponsors click here and to learn more about exhibitors, click here.
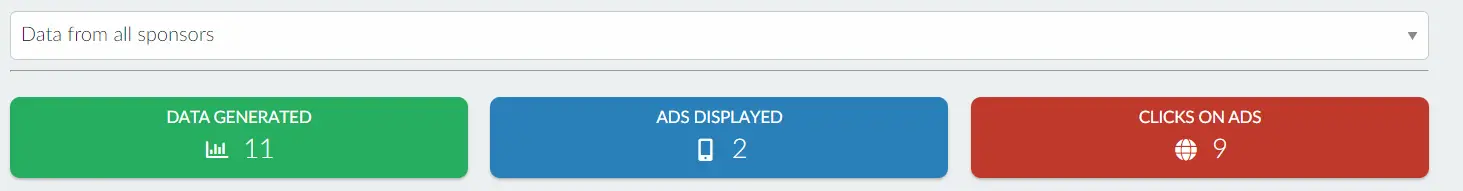
You can create advertisements for your sponsors and exhibitors which will be available in the app, you can also link the sponsor and exhibitor profile to their website. These statistics will help you understand the number of clicks and views each sponsor and exhibitor has received.
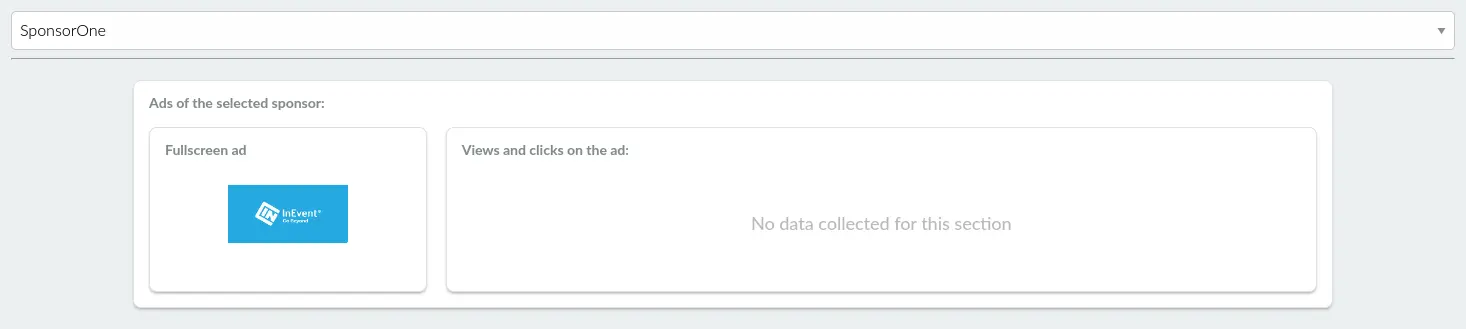
To view individual statistics of each sponsor and exhibitor, click on Data from all sponsors and select the specific sponsor or exhibitor from the drop down menu.
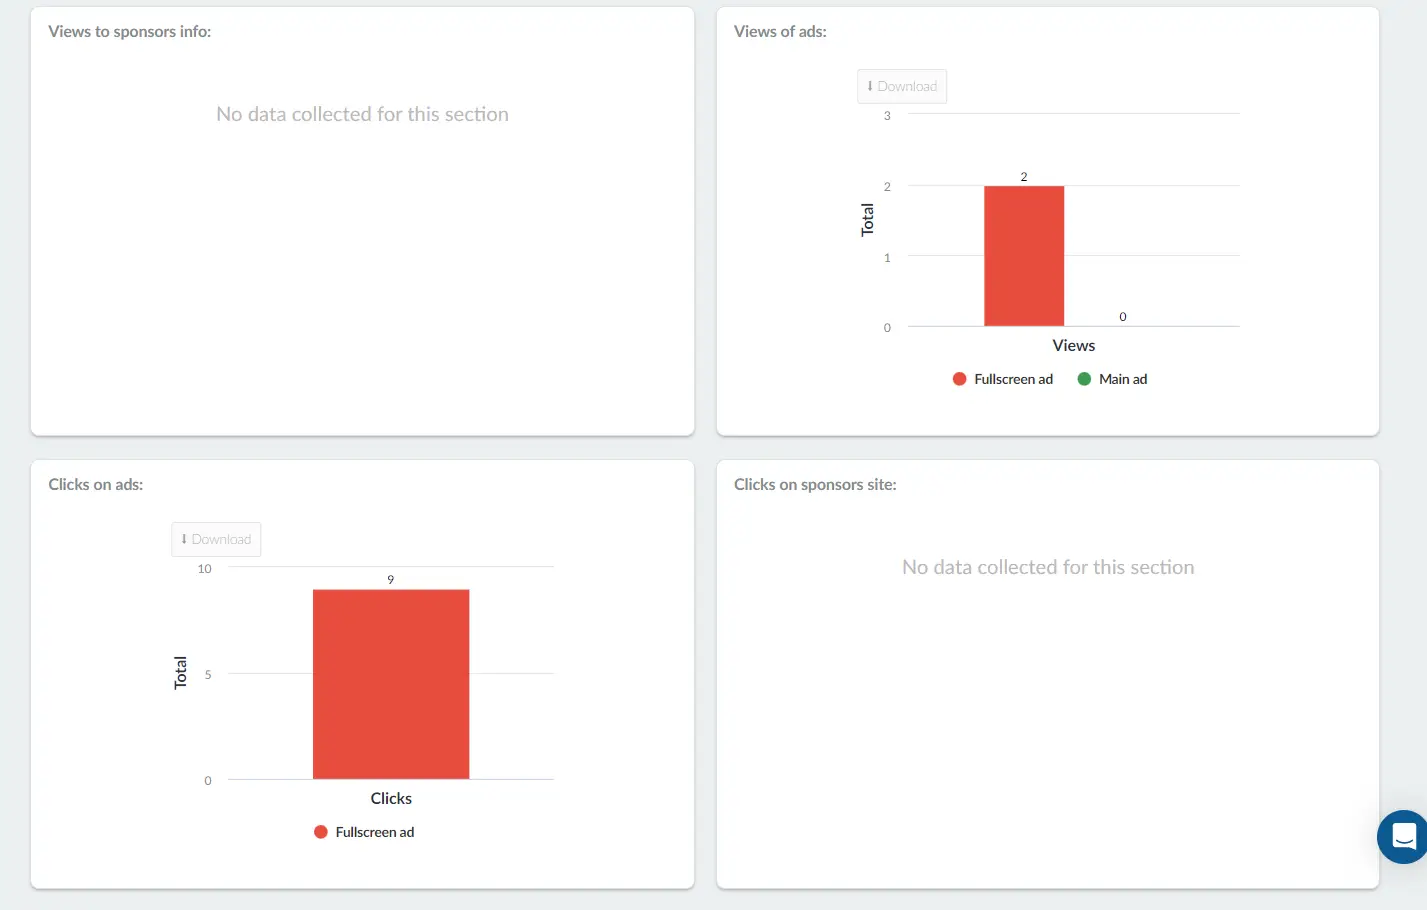
You will see these bar charts giving the following information:
- Views to sponsors info
- Views of ads
- Clicks on ads
- Clicks on sponsors site
Ads
Click on Ads to view the number of views and clicks each Advertisement has received. Select the Sponsor clicking on Data from all sponsors drop down:
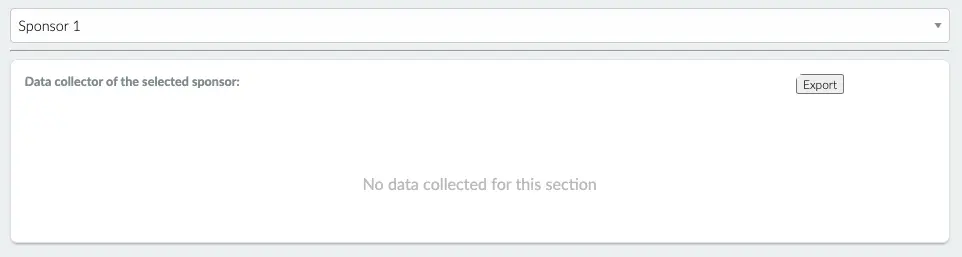
Data Collector screen overview
Here you can see the data collected by each sponsor using the Data collector tool. Click Here to learn more about the Data collector.
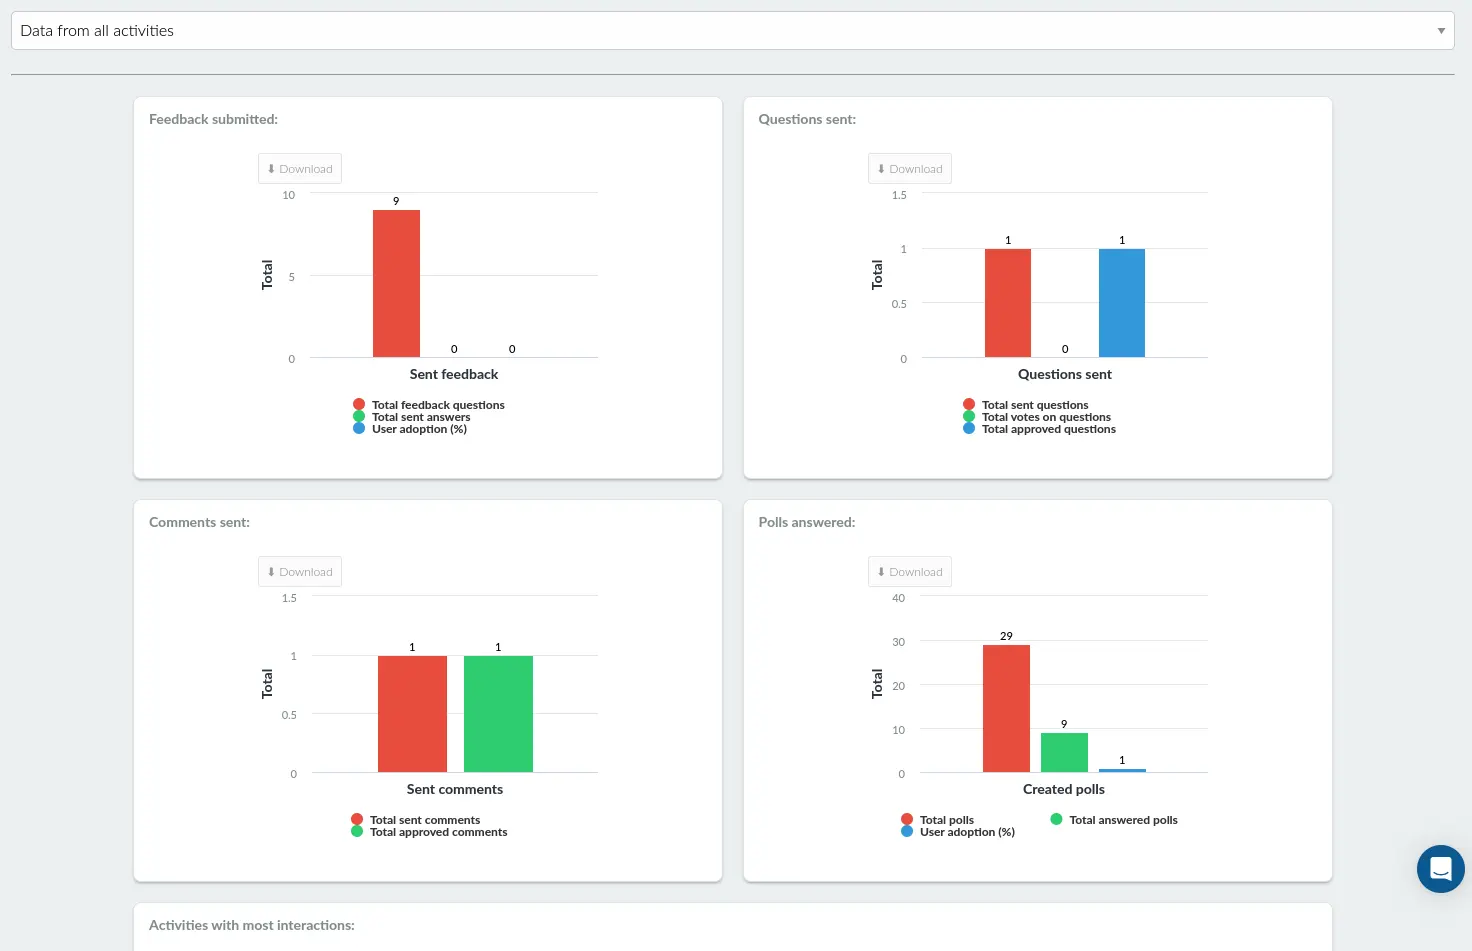
Activities screen overview
The Activities screen gives you a statistical overview of interactions within your activities such as questions, feedback, comments, and polls.
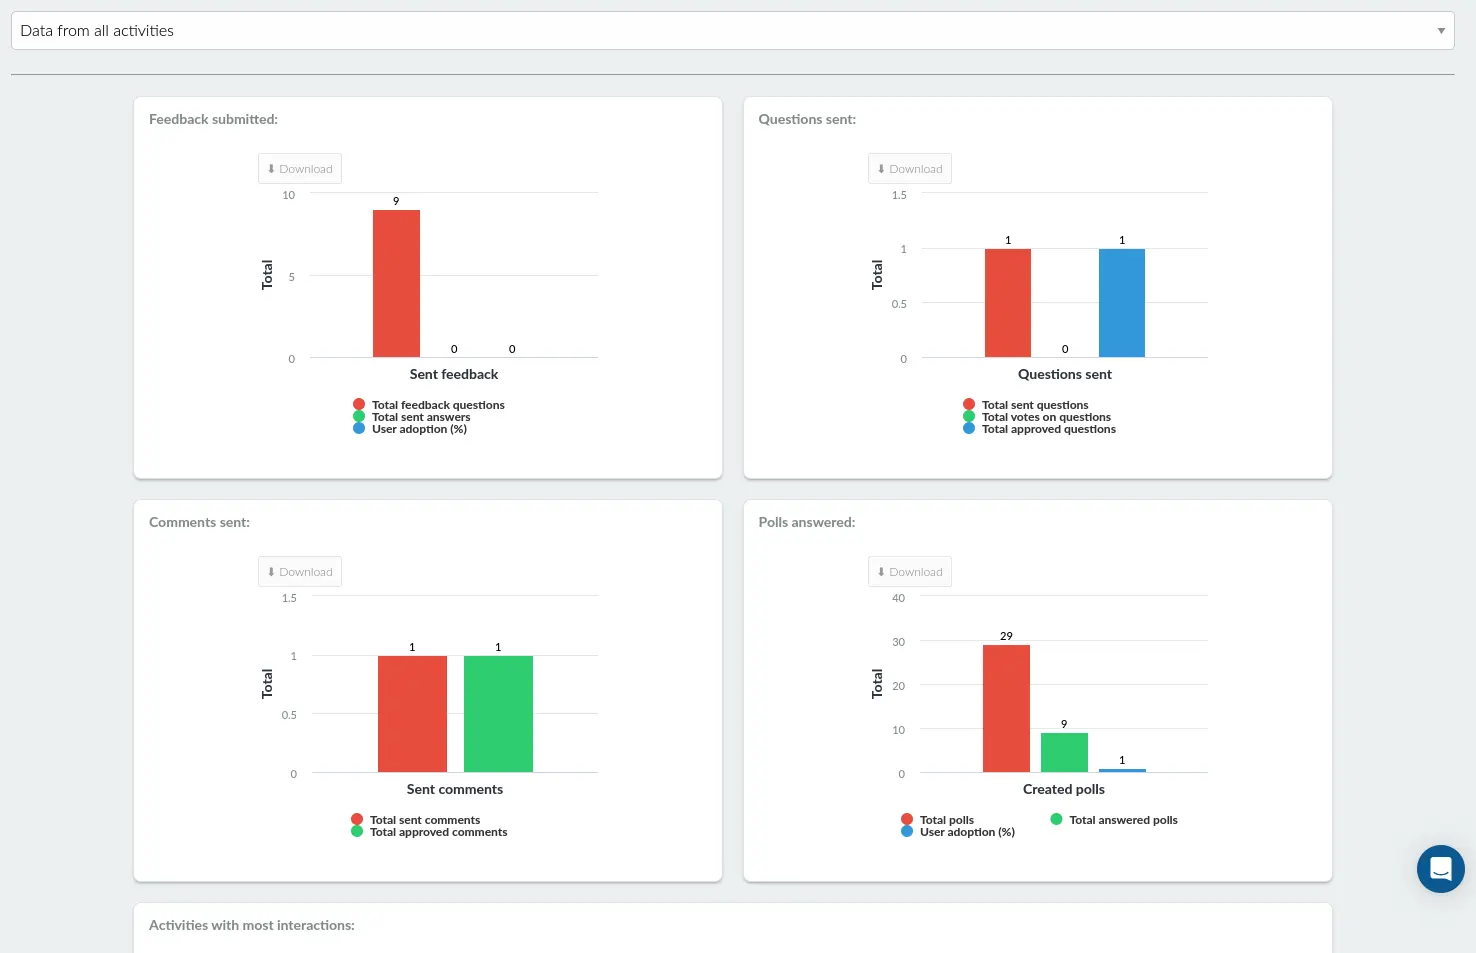
Click on Data from all activities and choose an activity to see the individual statistics for each activity.
Using the menu to the left, you can then browse through the interactions:
- Feedback
- Questions
- Forum
- Polls
Click on interaction, then at the top of the screen, choose the activity to see the interaction performed by each user.
Reports
You can download the generated reports by pressing the Download button in the left top corner of your chart. Check this article for more information about reports.