Checklog reports
 Updated 4 weeks ago
by
Caleb Kotey
Updated 4 weeks ago
by
Caleb Kotey
Here you can find a checklog report containing the check-in & check-out times and dates of your attendees.
The Checklog reports provide an Excel sheet export, a detailed log of individual check-in and check-out events under Check-in logs, and a Check-in analytics dashboard split into two tabs Overview and Attendance over time, with key metrics, filters, and visual charts to help you analyze attendance patterns.
Finding the Checklog reports
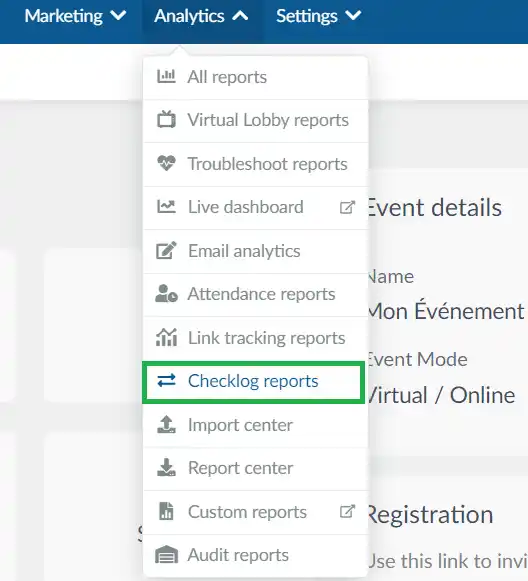
To go to your checklog, click on Analytics > Checklog reports.
To view the checklog analytics dashboard, click the Check-in analytics icon in the left sidebar of the Checklog reports page. The dashboard is split into two tabs: Overview and Attendance over time.
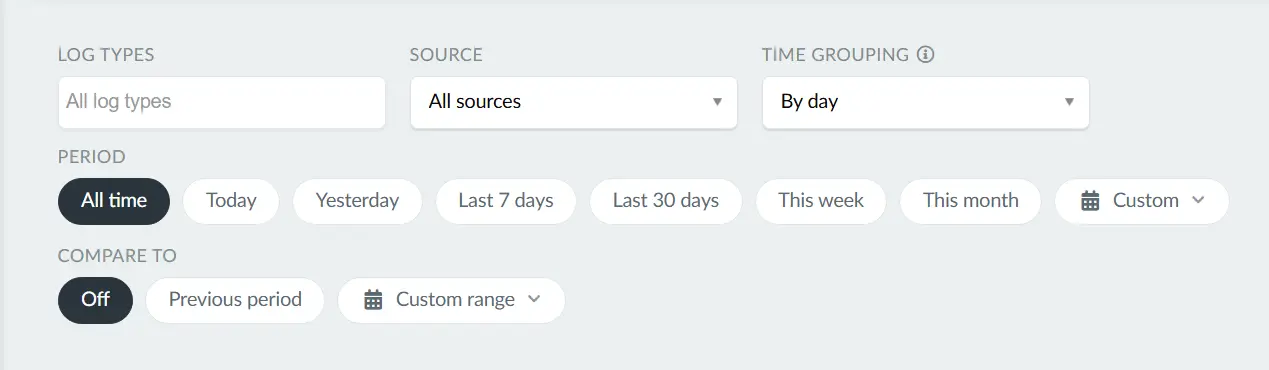
Both tabs share the following filters:
- Log types: Filter by all log types, Only event logs, Only activity logs, or any individual activity created in the event.
- Source: Filter by all sources, On-site (collectors), or Virtual Lobby.
- Period: All time, Today, Yesterday, Last 7 days, Last 30 days, This week, This month, or Custom.
- Compare to: Off, Previous period, or Custom range.
Overview
The Overview tab gives you a snapshot of overall attendance performance across the event.
Key metrics
The following metrics are displayed as individual cards:
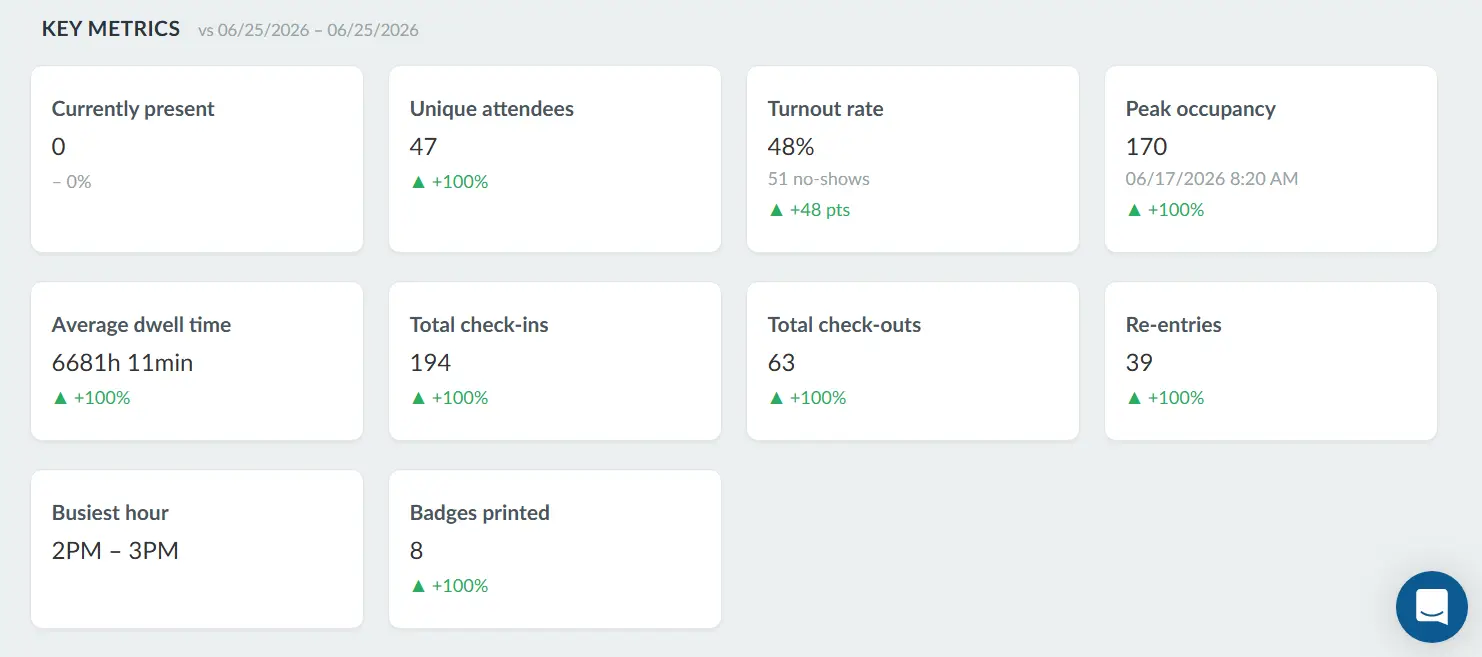
Metric | Description |
Currently present | Number of attendees currently on-site. |
Unique attendees | Total number of distinct attendees who checked in at least once. |
Turnout rate | Percentage of registered attendees who checked in. The number of no-shows is displayed beneath the percentage. |
Peak occupancy | The highest number of attendees on-site at the same time. The date and time of peak occupancy is displayed beneath the number. |
Average dwell time | The average duration of time attendees spent on-site. |
Total check-ins | Total number of check-in events recorded. |
Total check-outs | Total number of check-out events recorded. |
Re-entries | Number of times attendees checked back in after a previous check-out. |
Busiest hour | The one-hour window with the highest number of check-ins. |
Badges printed | Total number of badges printed. |
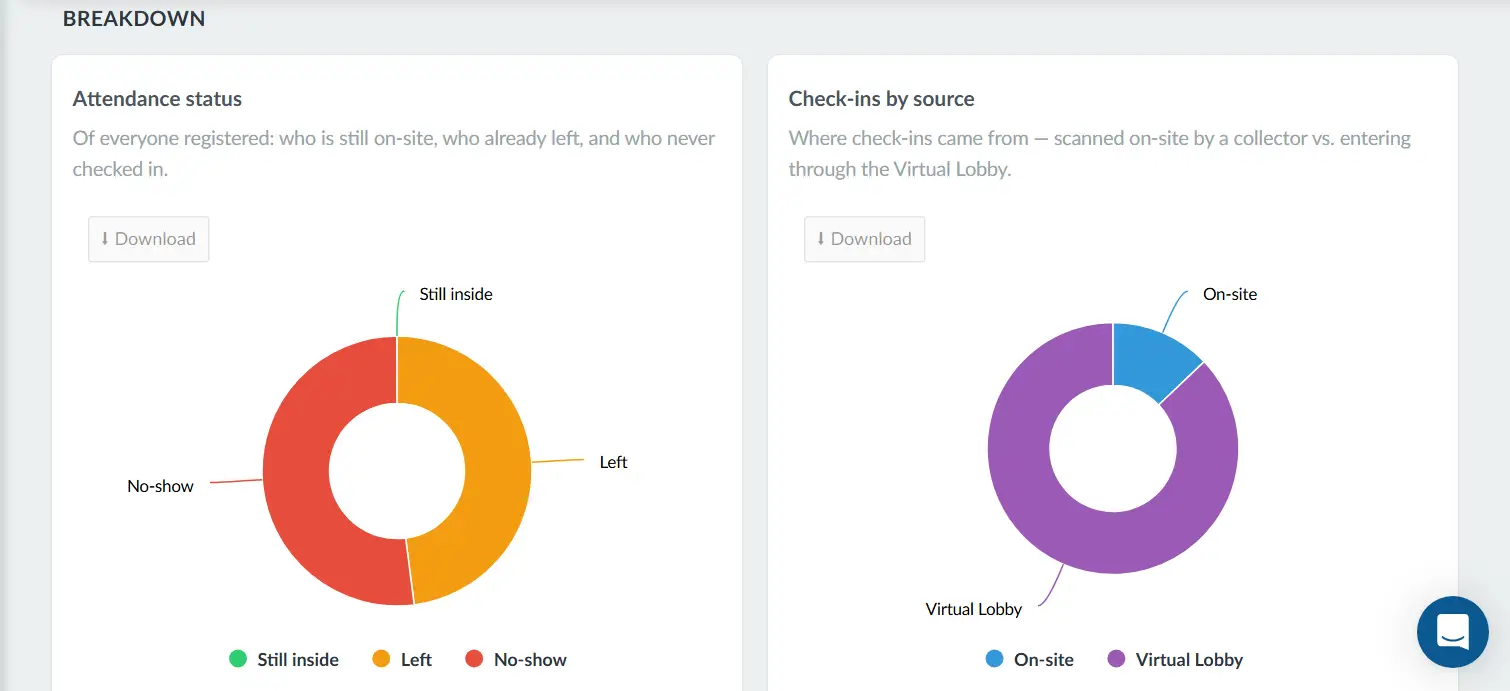
Breakdown
Below the key metrics, the Breakdown section contains two donut charts:
- Attendance status: Shows the distribution of everyone registered across three categories: Still inside (green), Left (orange), and No-show (red).
- Check-ins by source: Shows where check-ins originated, broken down between On-site (blue, scanned by a collector) and Virtual Lobby (purple, attendees entering through the Virtual Lobby).
Attendance over time
The Attendance over time tab shows how attendance evolved throughout the event using time-series charts.
In addition to the shared filters, this tab includes one extra filter:
Time grouping: Controls the interval used to group data in the Check-ins vs check-outs chart.
Options: By day or By 5 mins.
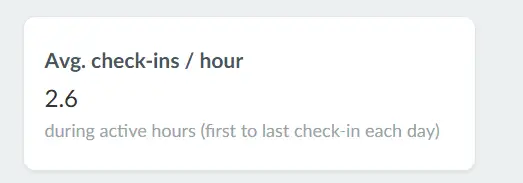
Summary metric
At the top of the tab, a summary card displays:
- Avg. check-ins / hour: The average number of check-ins per hour during active hours, calculated from the first to the last check-in of each day.
Charts
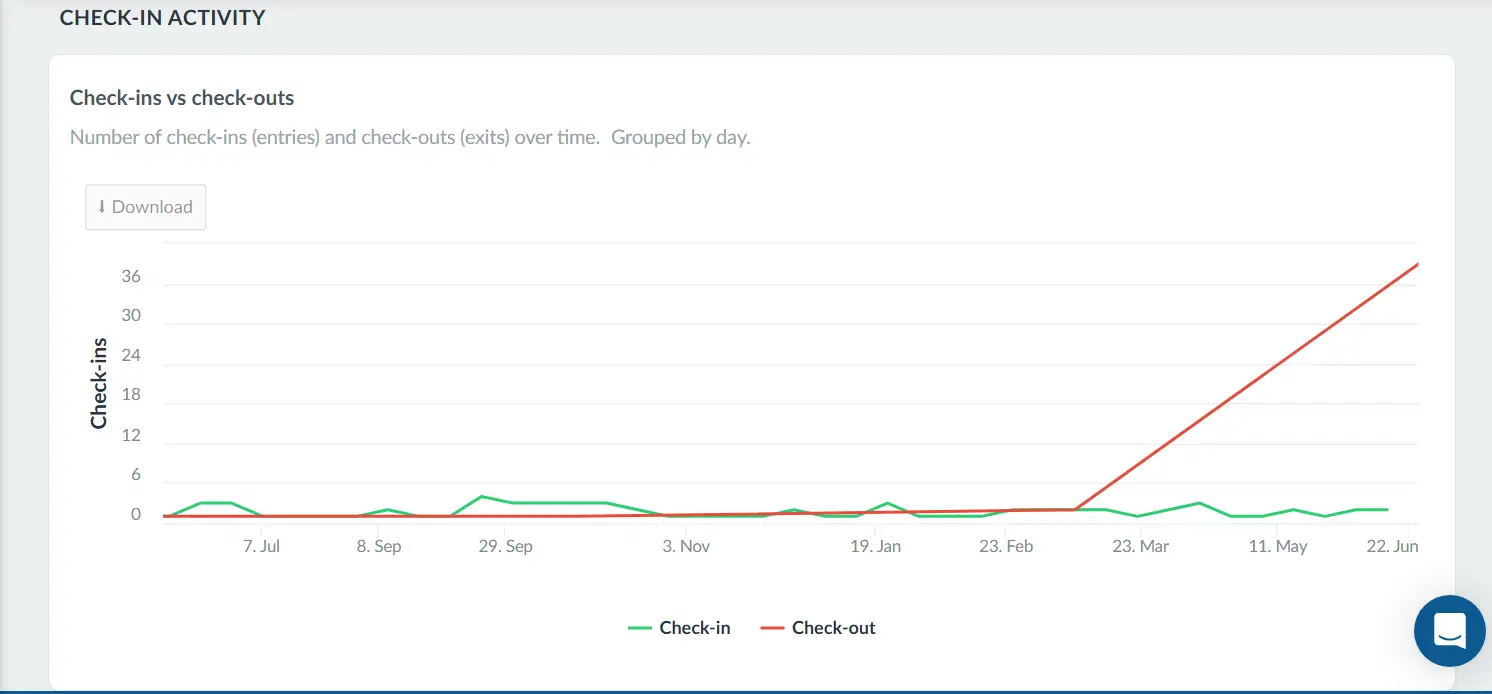
- Check-ins vs check-outs: A line chart showing the number of check-ins (entries, green) and check-outs (exits, red) over time. The time grouping filter controls whether data is grouped by day or in 5-minute intervals for intraday detail.
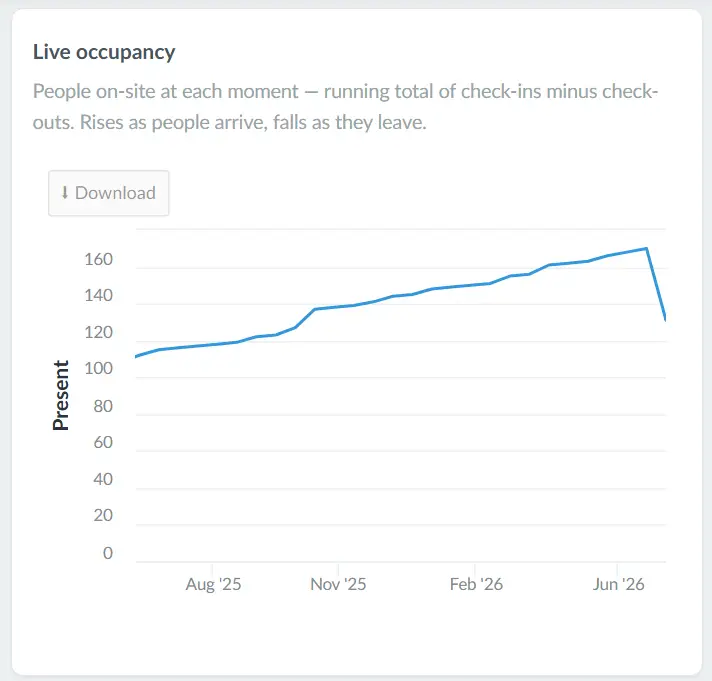
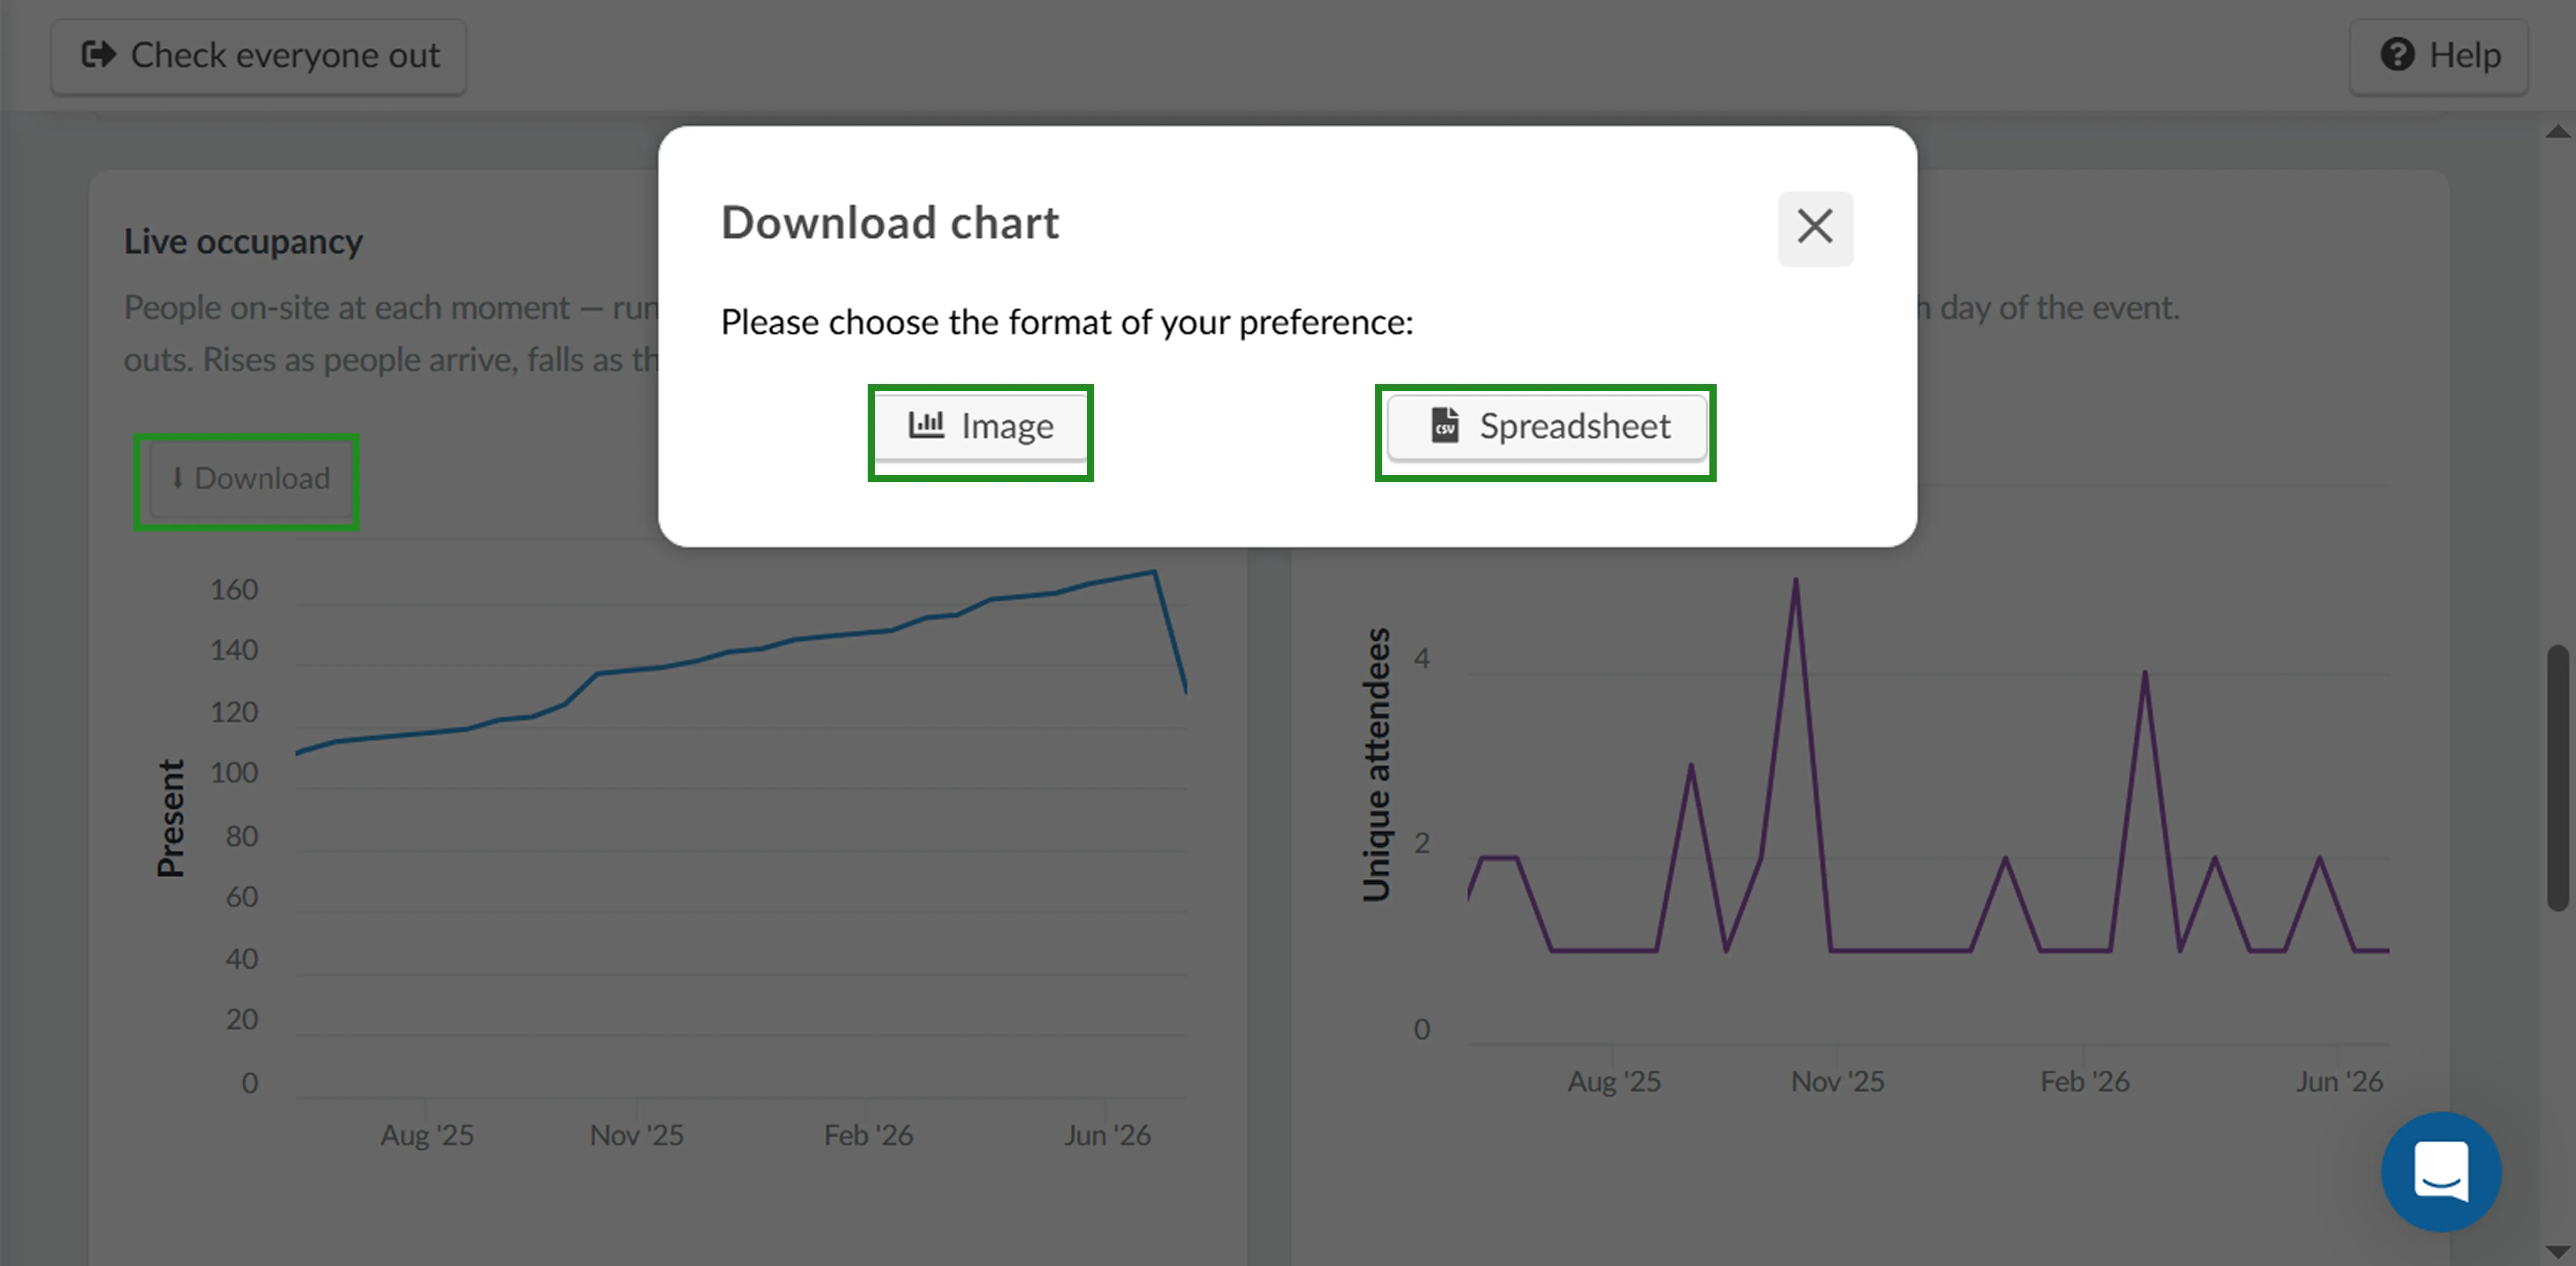
- Live occupancy: A line chart showing the number of people on-site at each moment. The value rises as attendees check in and falls as they check out, giving a running view of on-site presence over time.
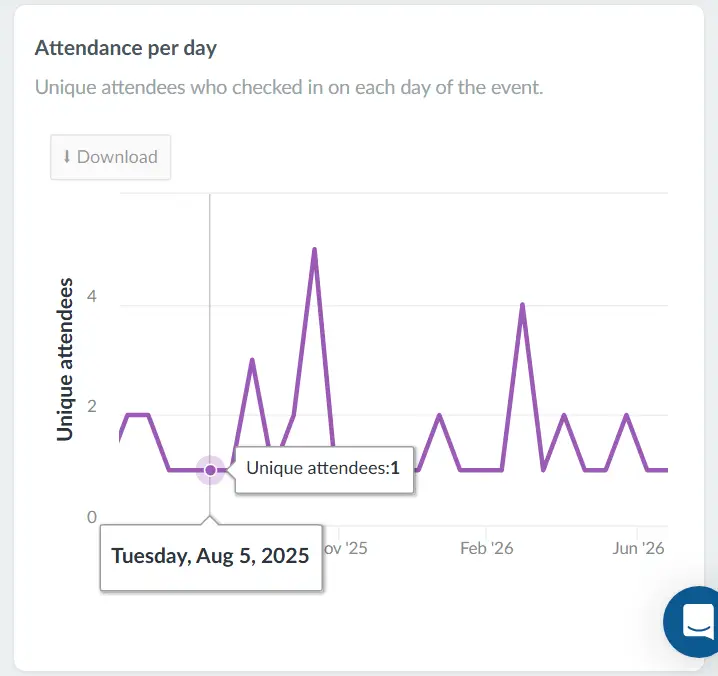
- Attendance per day: A line chart showing the number of unique attendees who checked in on each day of the event.
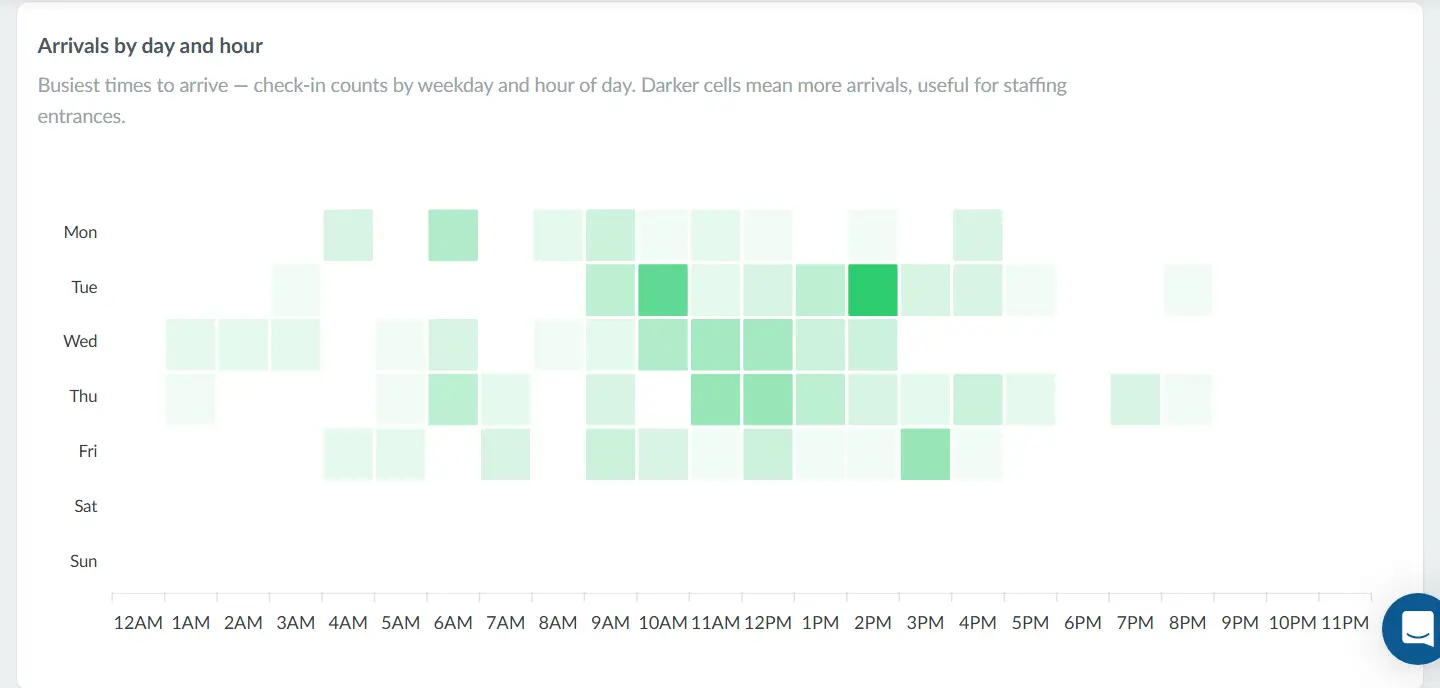
- Arrivals by day and hour: A heatmap showing the busiest arrival times by weekday and hour of day. Darker cells indicate more check-ins during that time window, making it useful for planning entrance staffing.
Check-in logs
Here you can view the full check log, which gives you information on the following:
The Check-in logs section contains the full record of individual check-in and check-out events for your attendees. It is split into two views: Distinct logs and Grouped logs.
Both views include a Period filter at the top, allowing you to narrow the log to: All time, Today, Yesterday, Last 7 days, Last 30 days, This week, This month, or a Custom date range.
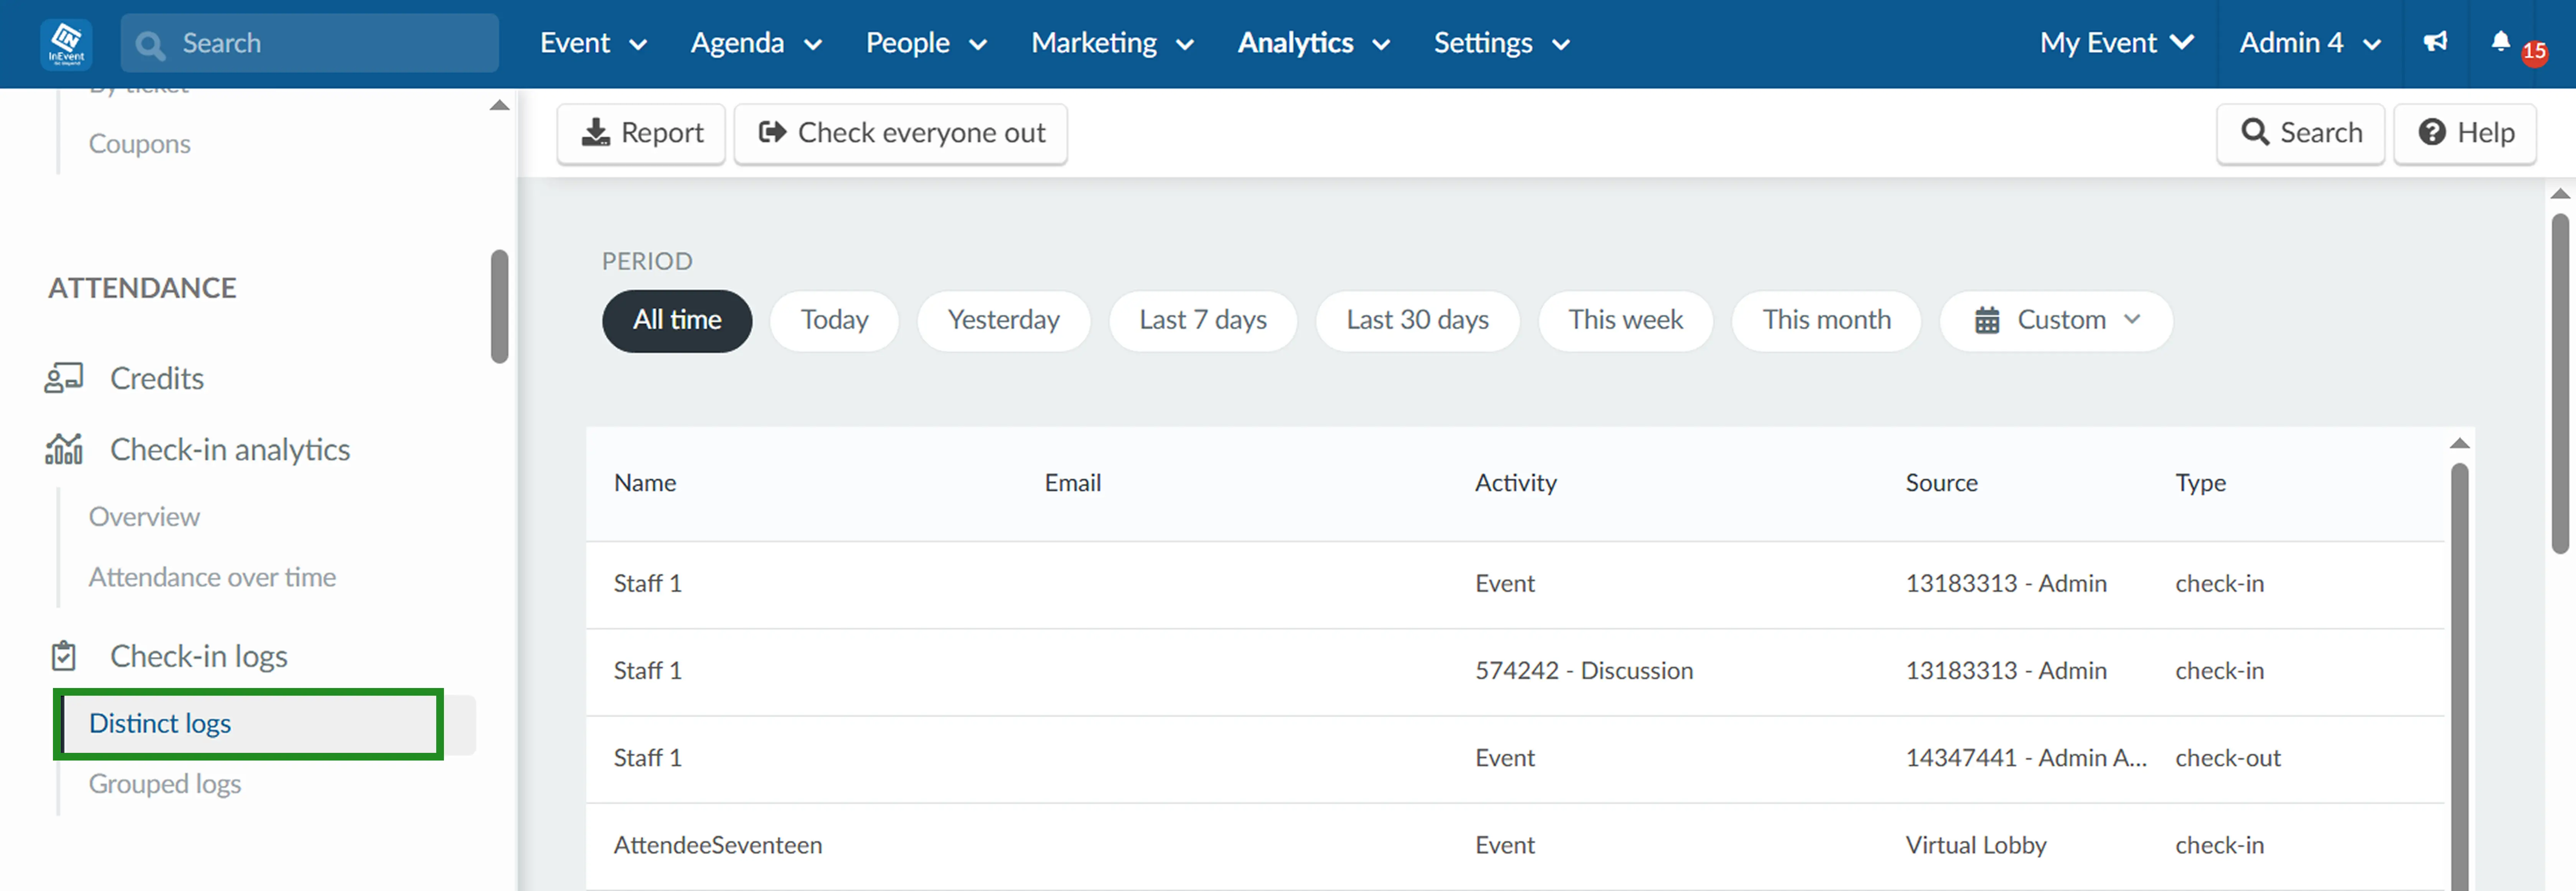
Distinct logs
Distinct logs shows each individual check-in and check-out event as a separate row.
Each row displays the following columns:
- Name: The name of the attendee.
- Email: The email address of the attendee.
- Activity: The activity the attendee checked into. Displays Event if it was an event-level check-in.
- Source: The means by which the attendee checked in (e.g. the collector ID and name).
- Type: The type of log entry: Print, Check-in, or Check-out.
- Date: The date and time of the event.
Grouped logs
Grouped logs consolidates the check-in and check-out events for each attendee, making it easy to review the time and duration each attendee spent at the event or activity.
To switch to Grouped logs, click Check-in logs in the left sidebar and select Grouped logs.
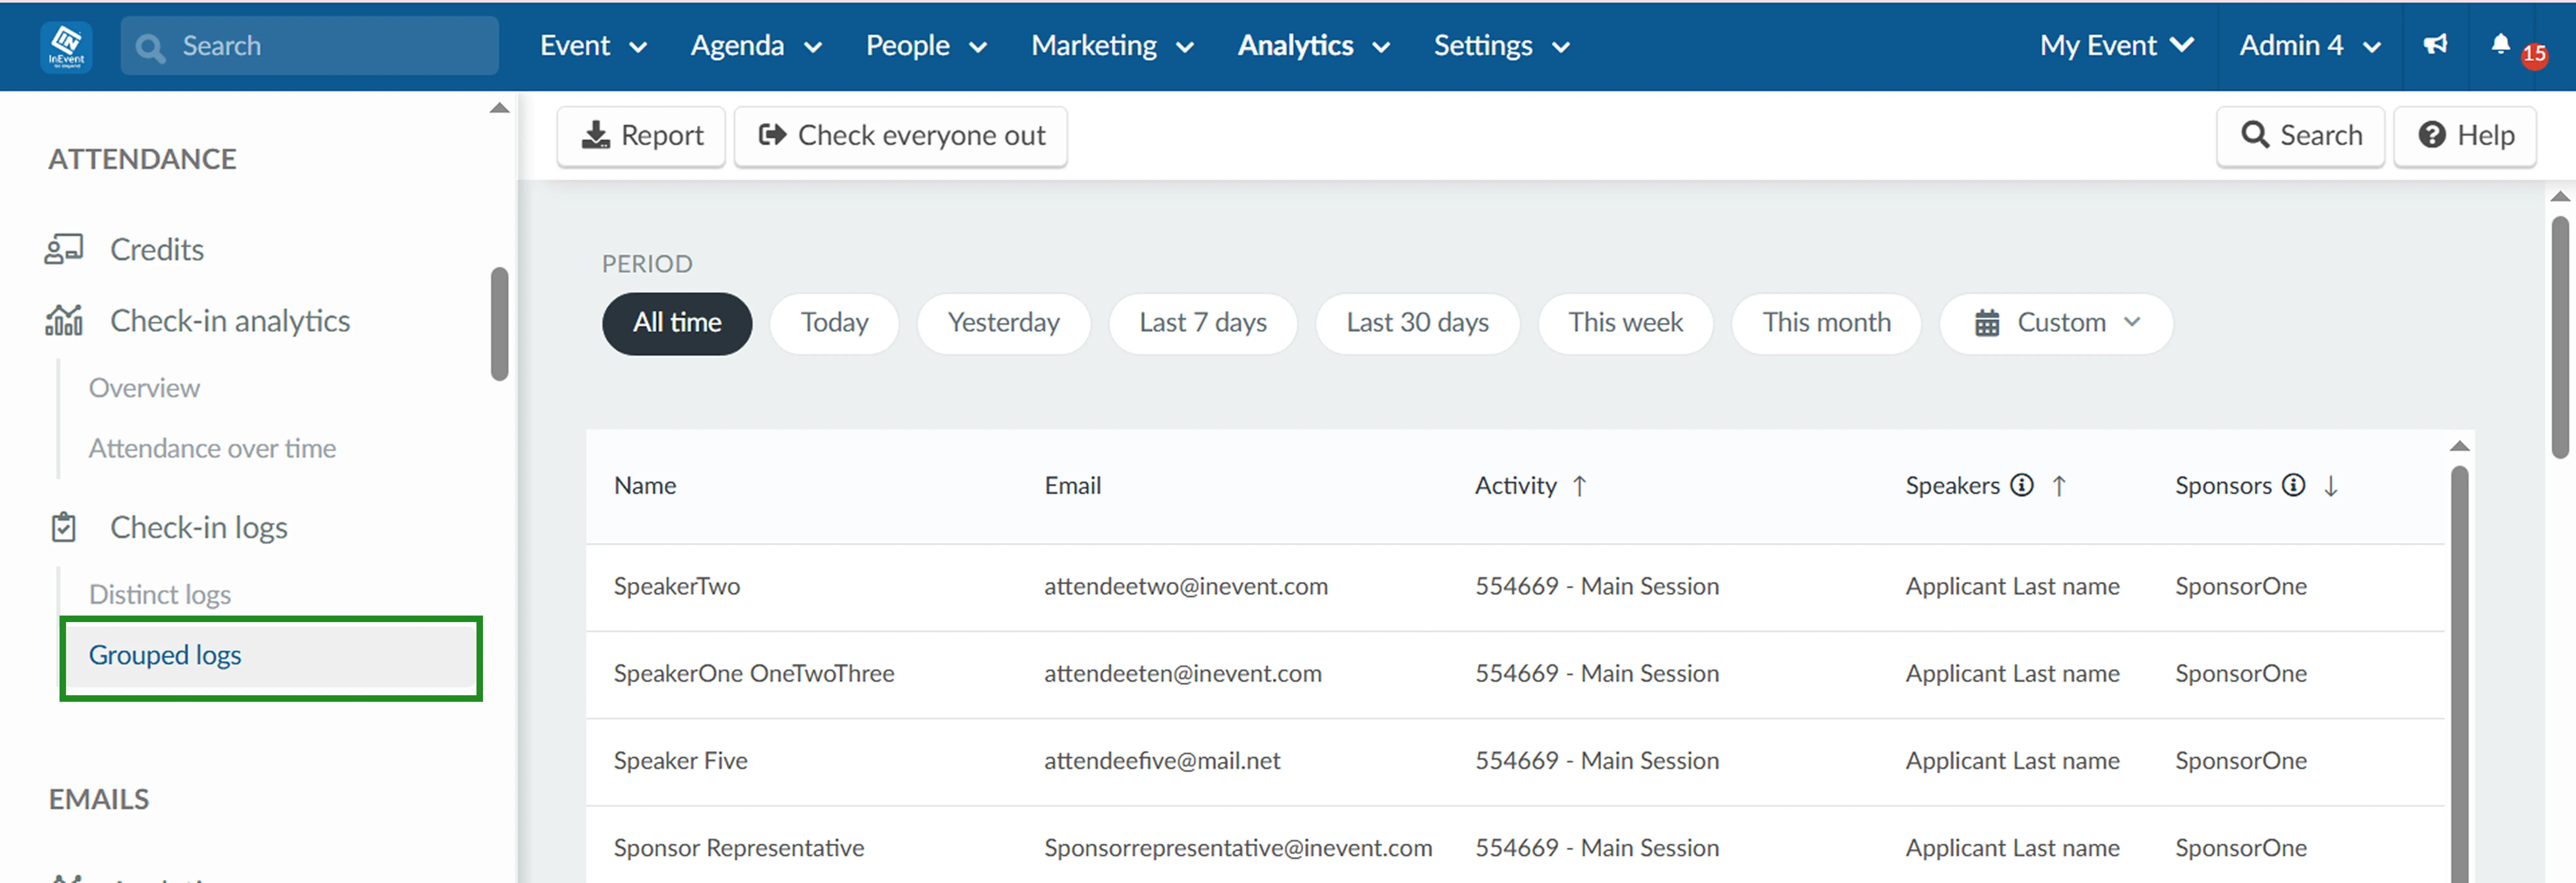
Each row displays the following columns:
- Name: Name of the attendee.
- Email: Email address of the attendee.
- Activity: The name and ID of the activity the attendee entered. Rows without an activity name are event-level check-in and check-out logs.
- Speakers: The speaker(s) associated with the activity during the attendee's visit.
- Sponsors: The sponsor(s) associated with the activity during the attendee's visit.
- Date check-in: The date and time the attendee checked in, including timezone.
- Date check-out: The date and time the attendee checked out, including timezone. Displays a dash if the attendee has not yet checked out.
- Duration: The total time spent by the attendee in the activity or event.
Sorting the fields
You can sort the fields in either view by clicking the up/down arrows next to each column header.
Report
To export an Excel report of the log, click the Report button in the top left corner.
You can select an automated report or a custom report. The custom report allows you to select which fields appear, whereas the automated report does not. The options for a custom report include columns from the Standard selections as well as Registration form fields and Custom registration form fields.
Check everyone out
This feature allows you to check out all attendees from either the entire event or a specific activity. You can choose to check attendees out immediately or schedule a check-out for a specific date.
This is useful when an event's activities have concluded for the day, allowing attendees to be scanned back in at a later time if needed.
To check everyone out, follow the steps below:
- Click Check everyone out at the top left.
- Choose from the dropdown whether you want to check out attendees from:
- The entire event, or
- A specific activity.
- Select the check-out date by clicking on the date field to open the calendar and choose a date.
- Click the red Check everyone out button.