Custom Reports
 Updated 1 month ago
by
Lorenzo
Updated 1 month ago
by
Lorenzo
Reports are your event's official log with results, actions and live data. It will allow you to select different sources of information to create customized reports for your event.
Creating a custom report
To create a custom report follow these steps
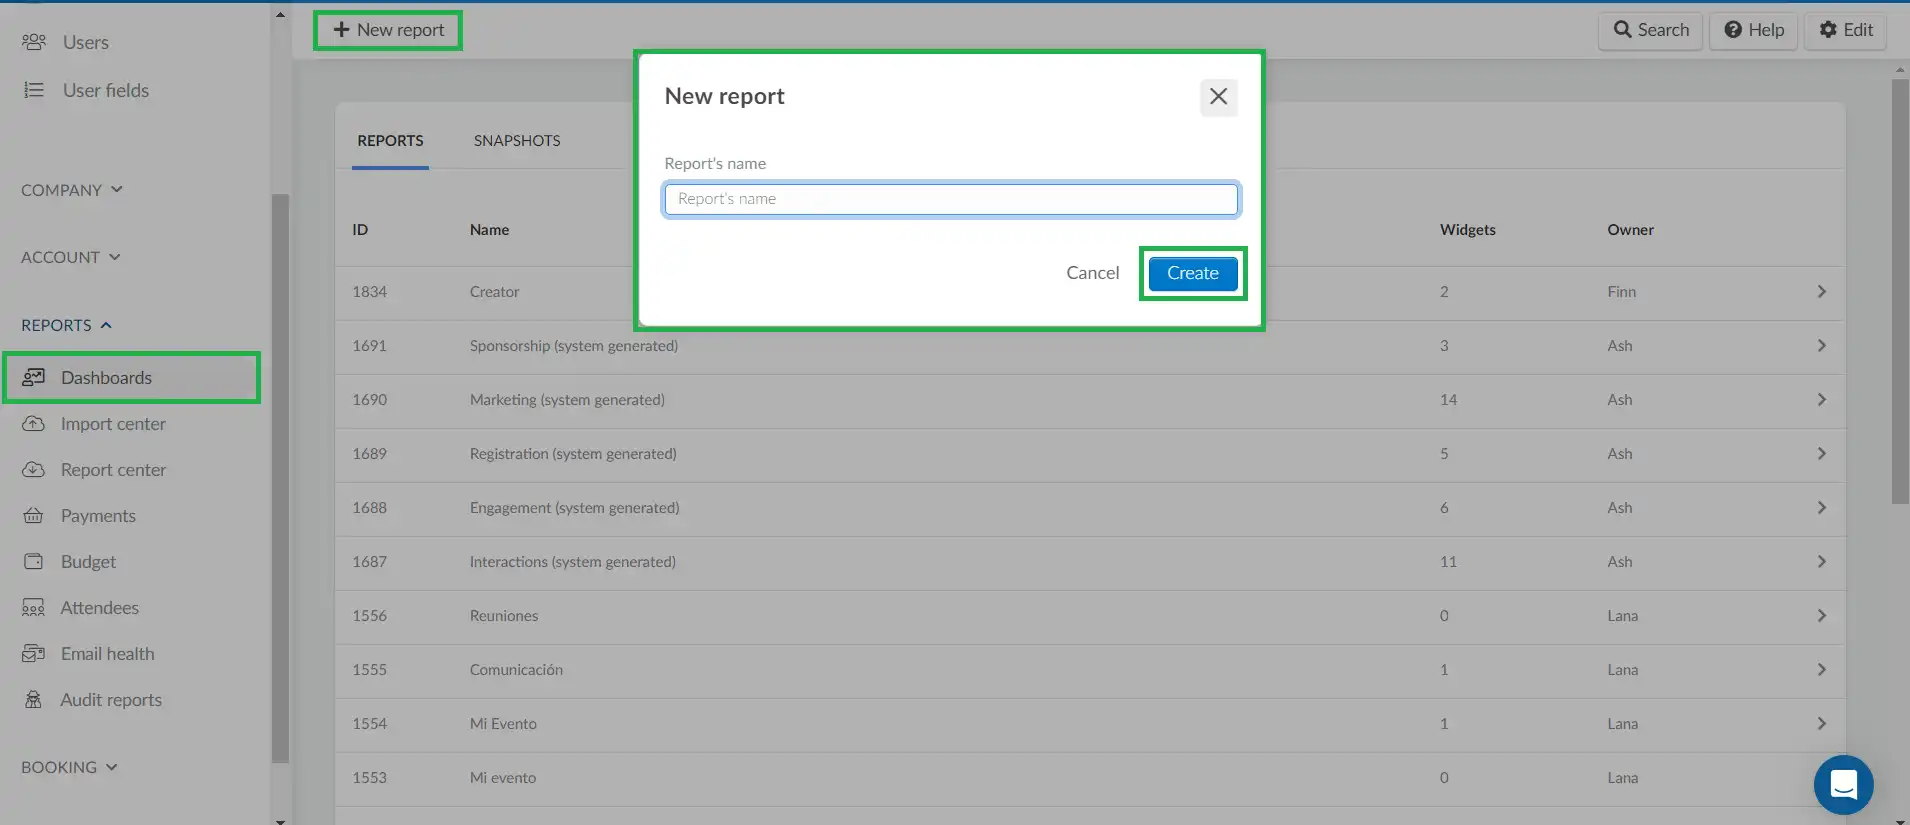
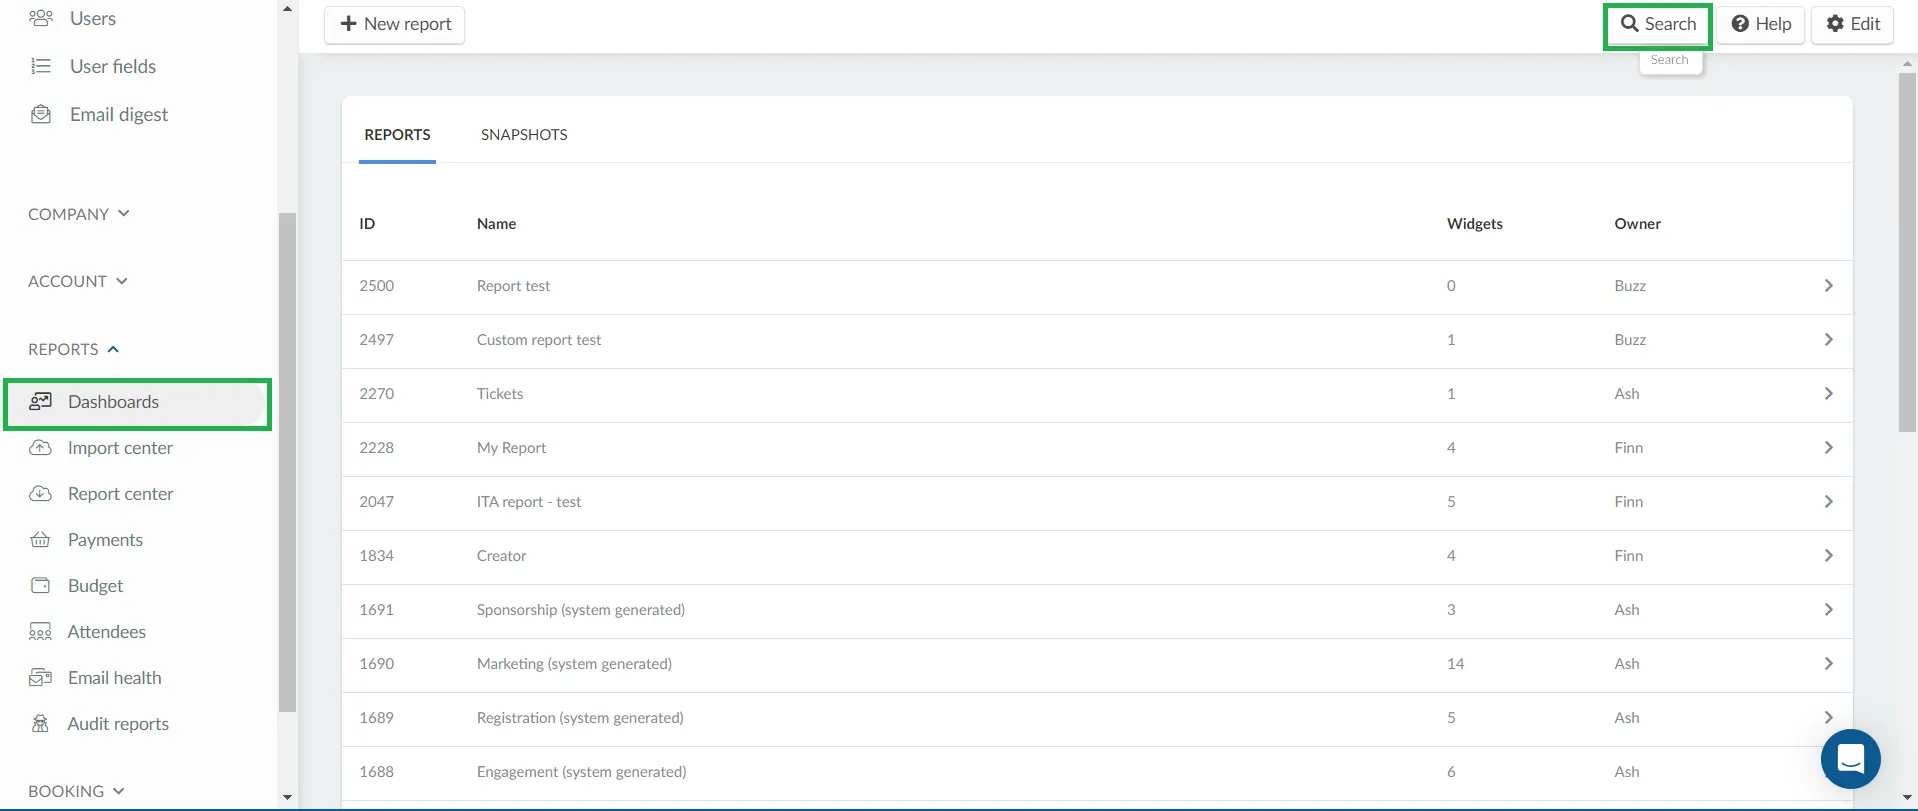
- Go to the Company level.
- Click on Reports > Dashboards from the left hand menu.
- Click on +New Report.
- Type in the name of the report in the New report box.
- Press the blue Create button.
Now your report has been created, you can choose the criteria.
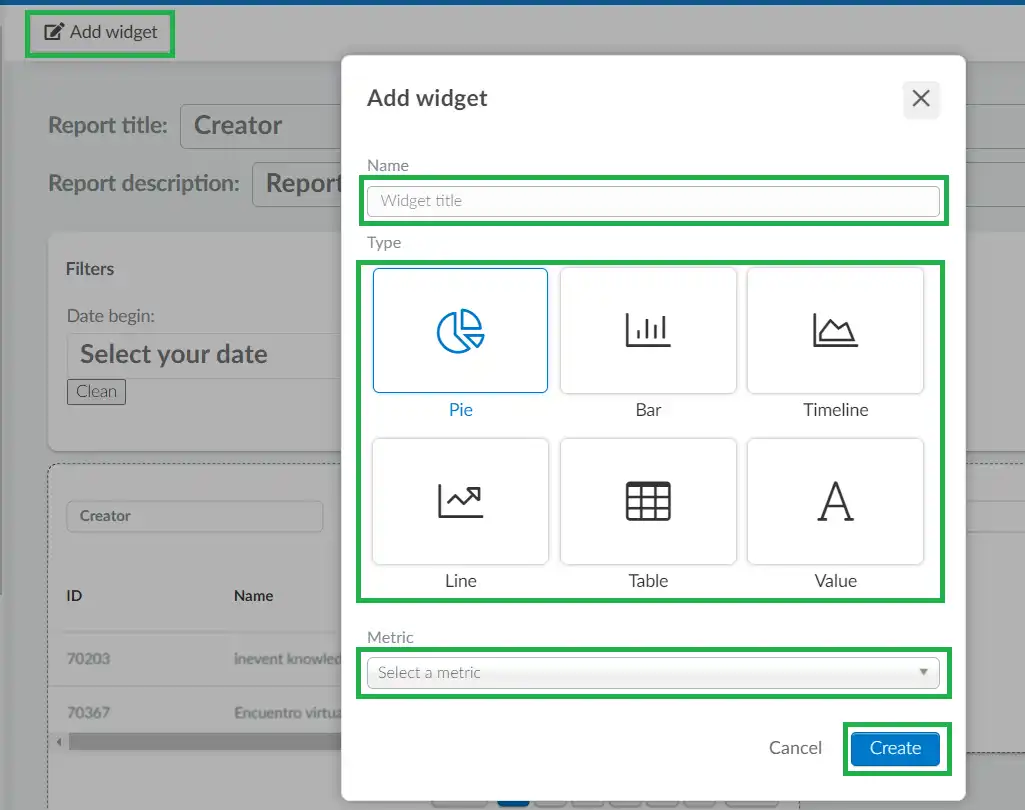
Adding a widget
To create the report start by choosing your Widget. Click on Add widget and type the name of the widget.
Then, choose type and select a metric, then press the blue Create button.
Metrics and Type
Please refer to the table below for a comprehensive list of metrics and their corresponding widget types:
Metrics | Widget type |
Templates | Pie, Bar, and Table |
Places | Pie, Bar, and Table |
Tickets sent This metric provides information on the total number of tickets given away by ticket holders to other users. You can use this report to filter the number of used and unused tickets that have been given out. To see how this report can be used, please refer to this section. | Pie, Bar, Table, Value |
Registrations per template | Pie, Bar, and Table |
Invitees per event | Pie, Bar, Table, and Value |
Registrations per event | Pie, Bar, Table, and Value |
Attendees per event | Pie, Bar, Table, and Value |
Attendees absent in person per event | Pie, Bar, Table, and Value |
Attendees absent online per event | Pie, Bar, Table, and Value |
Attendees present in person per event | Pie, Bar, Table, and Value |
Attendees present online per event | Pie, Bar, Table, and Value |
Unique companies on all events This gives report on the number of unique companies filled by registrants from all events. When using the Value widget type, the displayed number corresponds to the highest company appearance number. The number of other companies can be seen when you download the widget report. | Pie, Bar, and Value |
Tickets sold per event | Pie, Bar, Table, and Value |
Sales per event This metric shows only the total value of authorized tickets payments (received income). | Pie, Bar, Table, and Value |
Activities per event | Pie, Bar, Table, and Value |
Total virtual lobby sessions | Pie, Bar, Table, and Value |
Total virtual lobby rooms | Pie, Bar, Table, and Value |
Speakers per event | Pie, Bar, Table and Value |
Sponsors per event | Pie, Bar, Table, and Value |
Sponsor booths per event | Pie, Bar, Table, and Value |
Group rooms per event | Pie, Bar, Table and Value |
Speed networking rooms per event | Pie, Bar, Table and Value |
Breakout rooms per event | Pie, Bar, Table and Value |
Meetings per event | Pie, Bar, Table and Value |
Questions per event | Pie, Bar, Table and Value |
Comments per event | Pie, Bar, Table and Value |
News feed post per event | Pie, Bar, Table and Value |
Polls per event | Pie, Bar, Table and Value |
Quizzes per event | Pie, Bar, Table and Value |
Polls answers per event | Pie, Bar, Table, and Value |
Quiz answers per event | Pie, Bar, Table and Value |
Feedback answers per event | Pie, Bar, Table and Value |
Survey answers per event | Pie, Bar, Table and Value |
Emails sent per event | Pie, Bar, Table and Value |
Emails delivered per event | Pie, Bar, Table and Value |
Emails bounced per event | Pie, Bar, Table and Value |
Emails spam complaints per event | Pie, Bar, Table, and Value |
Emails opened per event | Pie, Bar, Table, and Value |
Emails CTA clicks per event | Pie, Bar, Table and Value |
Emails CTA conversions per event | Pie, Bar, Table and Value |
UTM clicks per event | Pie, Bar, Table and Value |
UTM conversions per event | Pie, Bar, Table and Value |
File downloads per event | Pie, Bar, Table and Value |
Uploaded files per event | Pie, Bar, Table and Value |
Ad Interactions per event | Pie, Bar, Table and Value |
Website visits per event | Pie, Bar, Table and Value |
Exchanged messages per event | Pie, Bar, Table and Value |
Connections per event | Pie, Bar, Table and Value |
Missions completed per event | Pie, Bar, Table and Value |
Invitations overtime | Timeline |
Registrations overtime | Timeline |
Attendees overtime | Timeline |
Budget | Line |
List of registrants | Table |
List of events | Table |
List of templates | Table |
List of checklogs | Table |
Revenue per event This metric shows the net volume, pending payments and refunded payments of each event | Table |
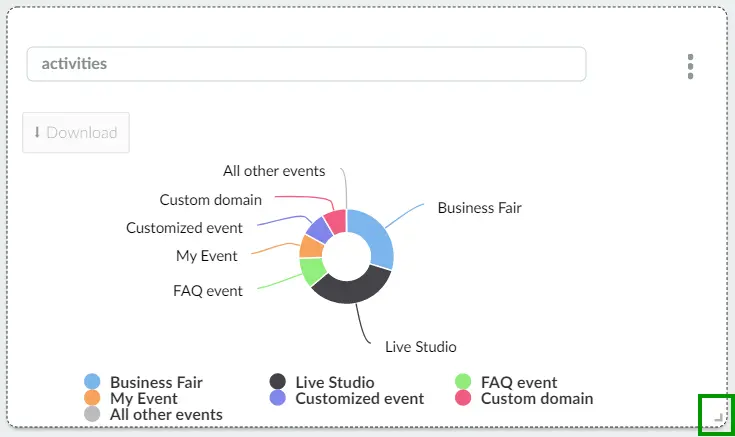
Once your widget has been created you can drag the bottom right corner to enlarge the size.
Deleting a widget inside your report
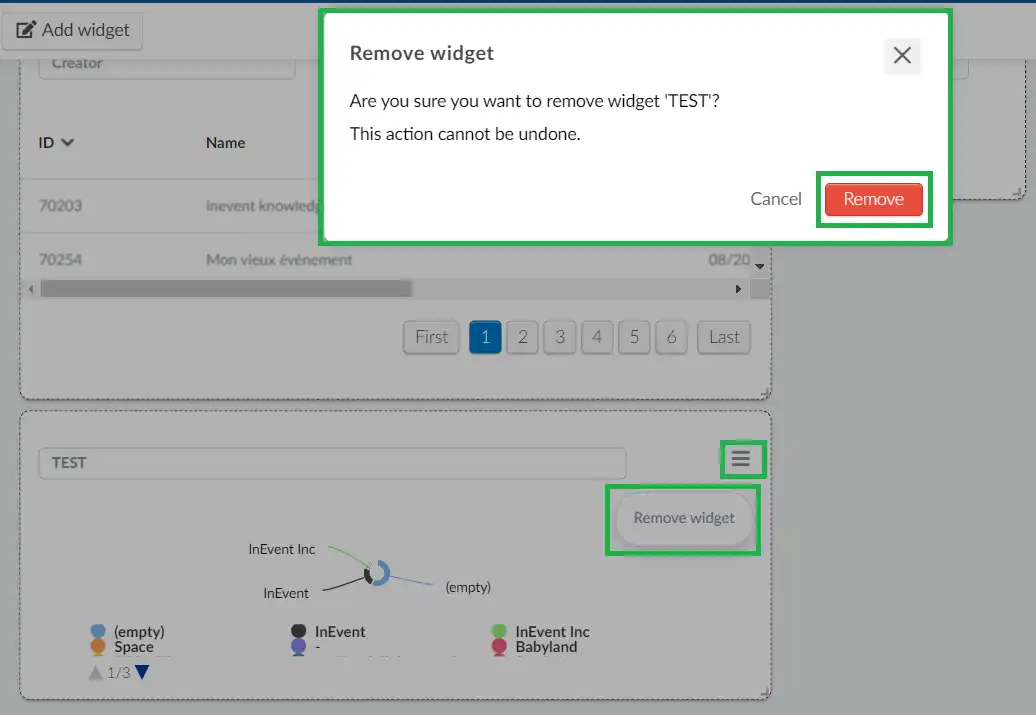
To delete a Widget inside your custom report simply click on Edit in the top right corner of the page and click on the 3 dashes icon in the right top corner of your widget and press Remove widget. A confirmation box will appear for you to confirm the action. Click on Remove.
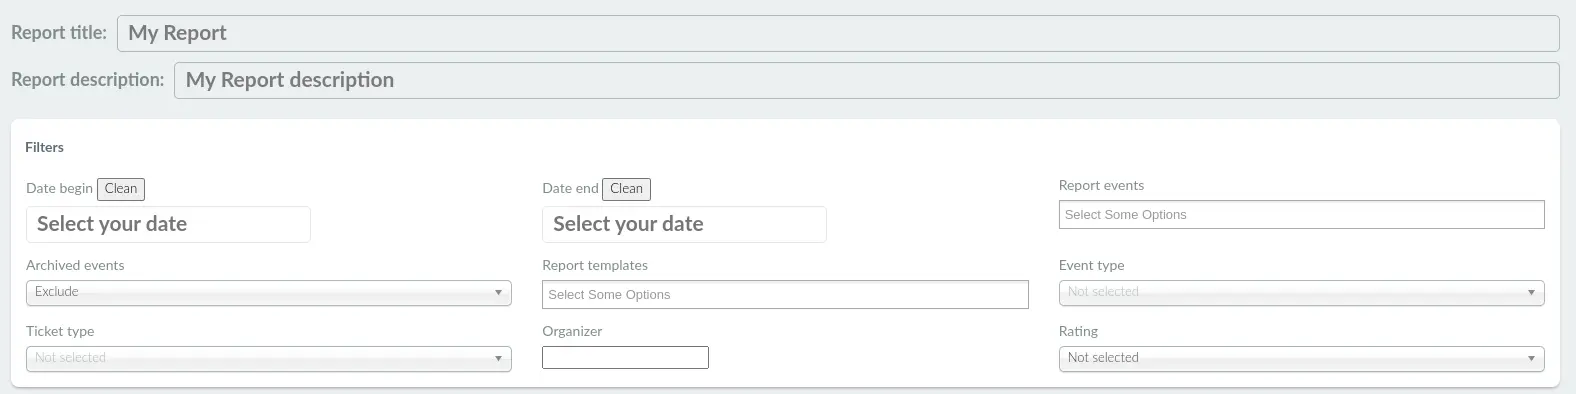
Filters
You can use Filters to obtain specific results for your report. The available filters are as follows:
- Date begin and Date end: Specifies the data time and date range of your report.
- Report events: Specifies the events that will be included in the report.
- Archived events: Determines whether or not archived events will be included in the report.
- Report templates: Specifies the templates that will be included in the report.
- Custom fields: If you have created Custom fields, they will be visible here as filters.
Below is an example of a Ticket Sent widget report, displaying the total number of tickets given out in a selected event. This report allows you to filter further by Ticket status, showing the count of given-out tickets that have been used (accepted) and unused (unaccepted).

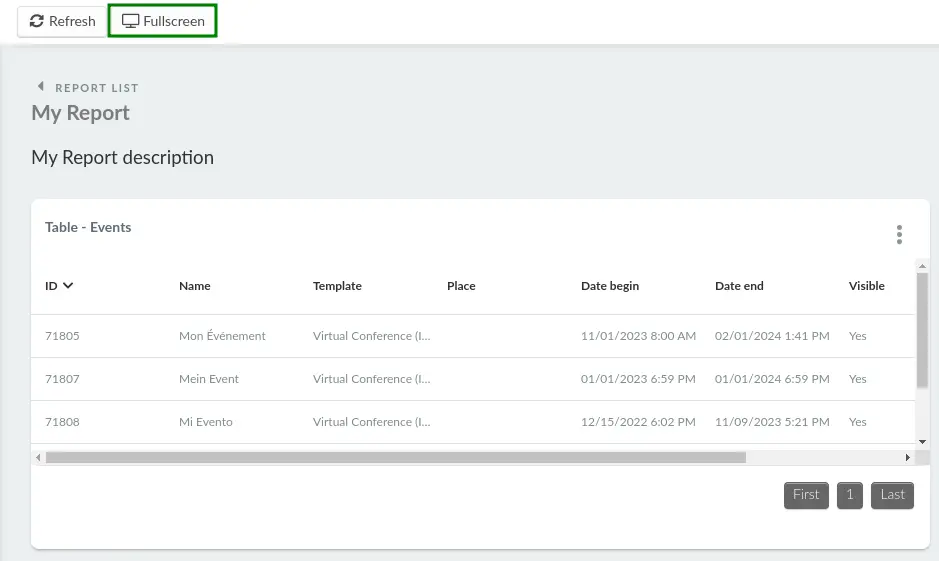
Fullscreen
To view your widget reports in a better view, click the Fullscreen button in the top left corner.
Snapshot
The snapshot feature allows users to create snapshot of their report with all the recent data available. Simple click on the Snapshot button on the platform. A new prompt message will be displayed, click on create to finalize.
Editing a report
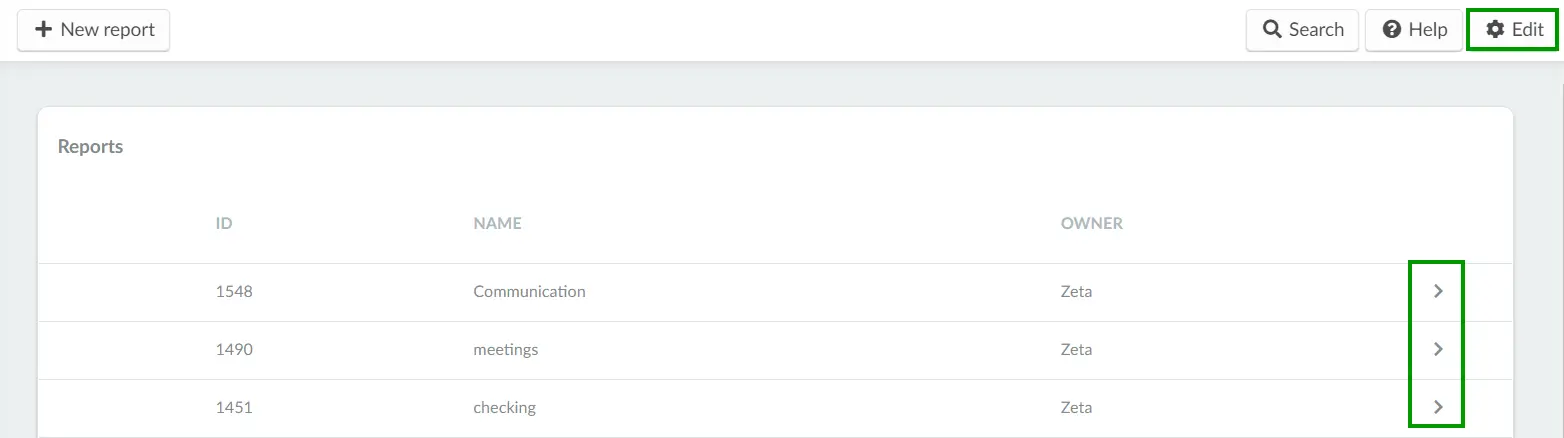
To edit a report click on the > on the right side of the report. Then, click the Edit button in the top right corner. Now you should be able to edit an existing report.
Deleting a custom report
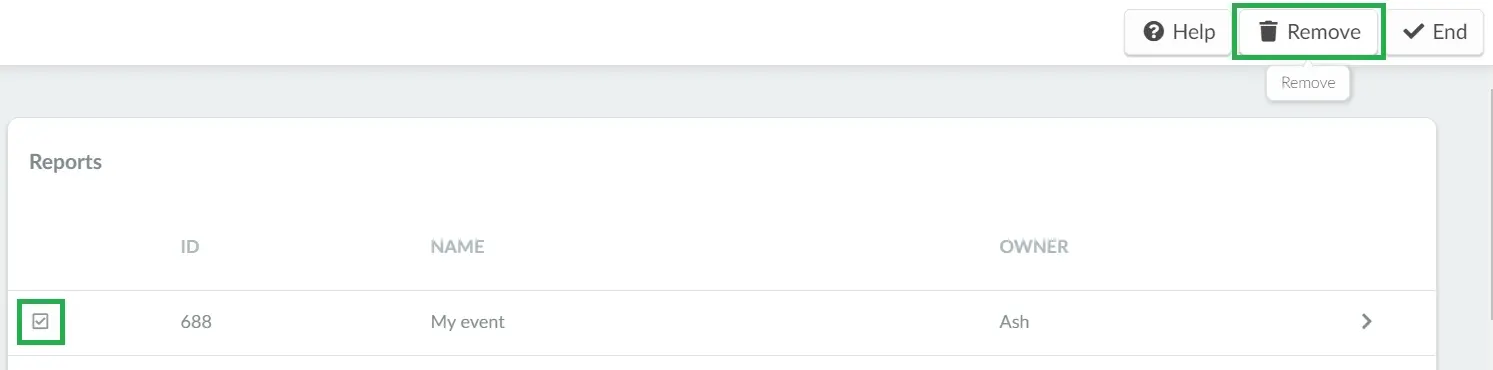
To delete a report, click on Edit in the top right corner. Then, tick the check box of the report you wish to delete and press the Remove button in the top right corner.
Searching for a report
To find a report quickly, use the Search button located at the top right corner of the Reports > Dashboard page. Simply enter the report name into the search bar, and the relevant report will be displayed instantly.
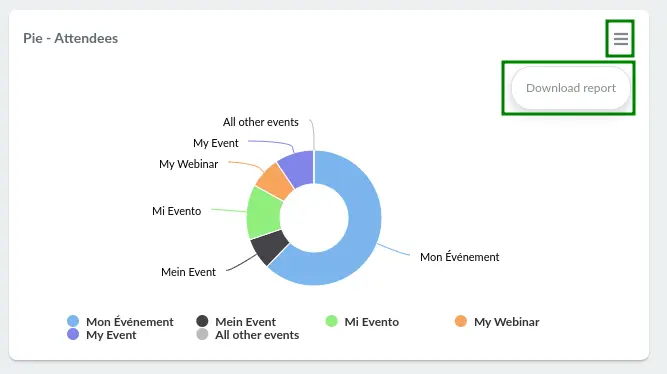
Downloading a report
After creating a report and adding a widget, you can download the generated reports by pressing the 3 dots icon in the right top corner of your widget and clicking Download report.
The file will be saved in your default download location.