Event Summary
 Updated 10 months ago
by
Chioma Okenwa
Updated 10 months ago
by
Chioma Okenwa
This page is where you can access your main actions and check basic information regarding your event in a handy way.
Where can I find it?
At the event level, simply go to Event > Summary.
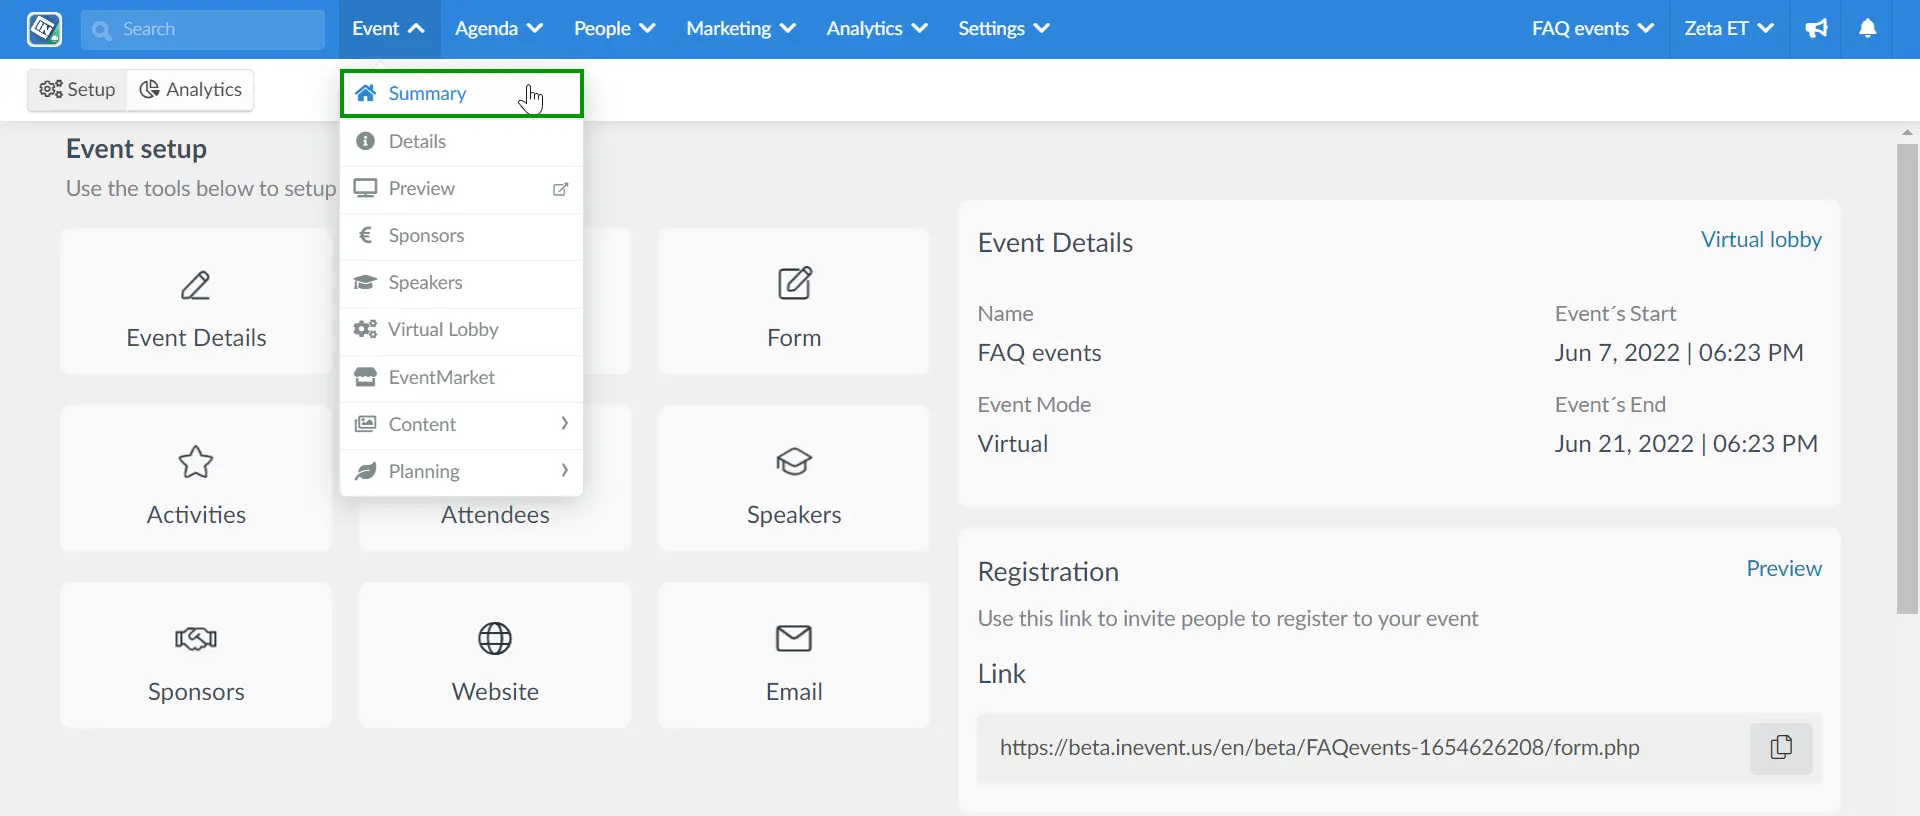
Main actions
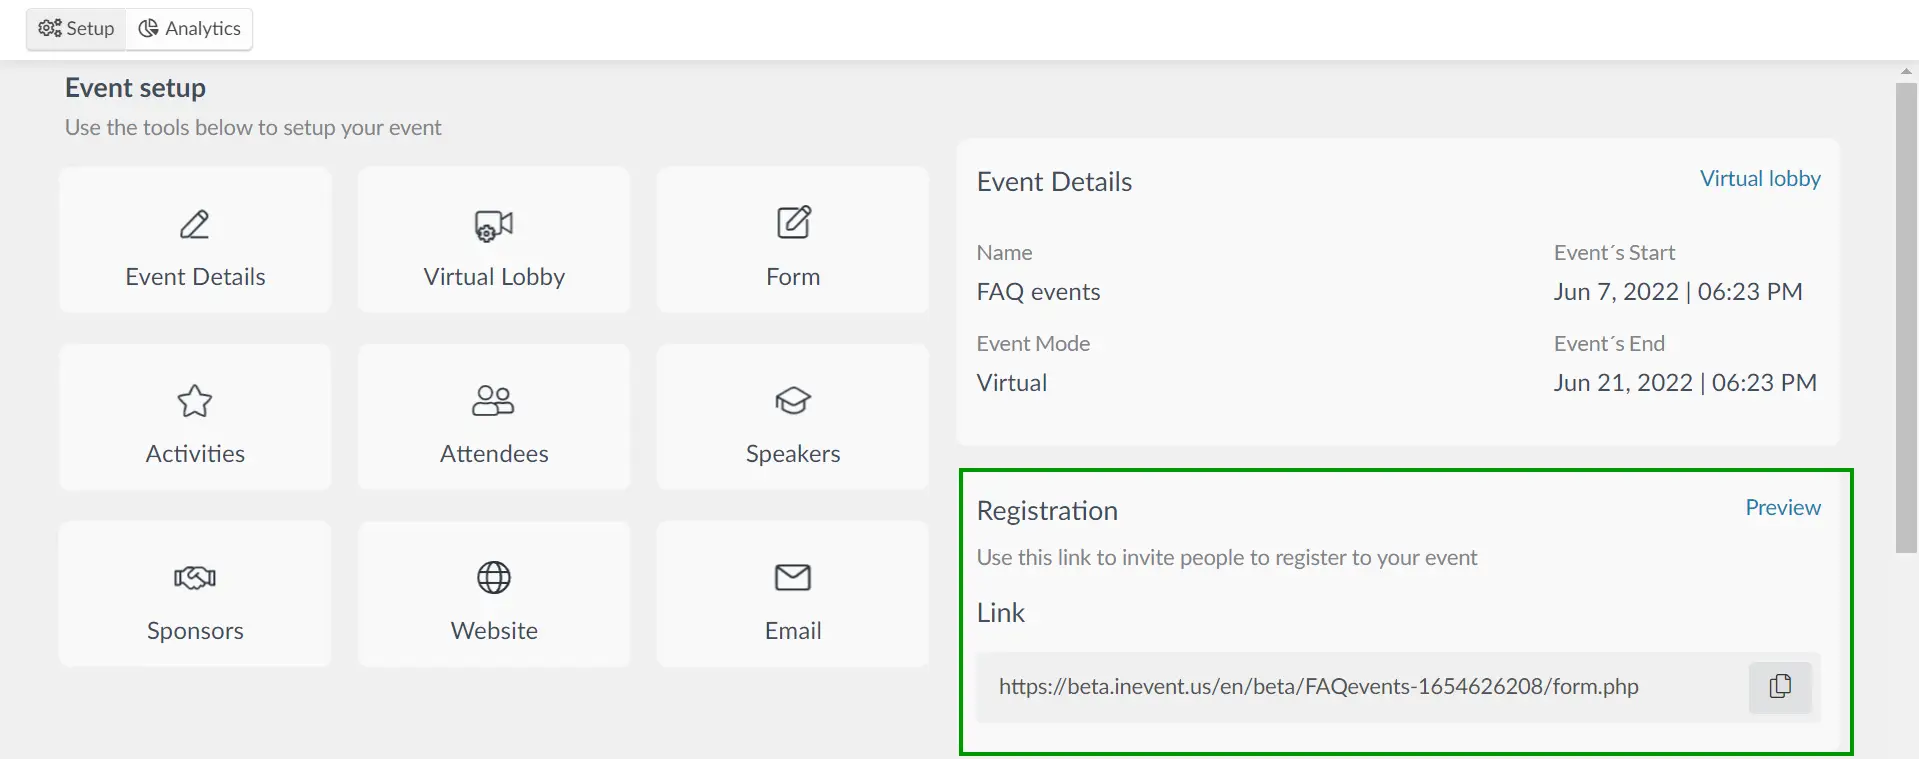
Event setup
Here you can find the main actions you can perform setting up your event on our platform.
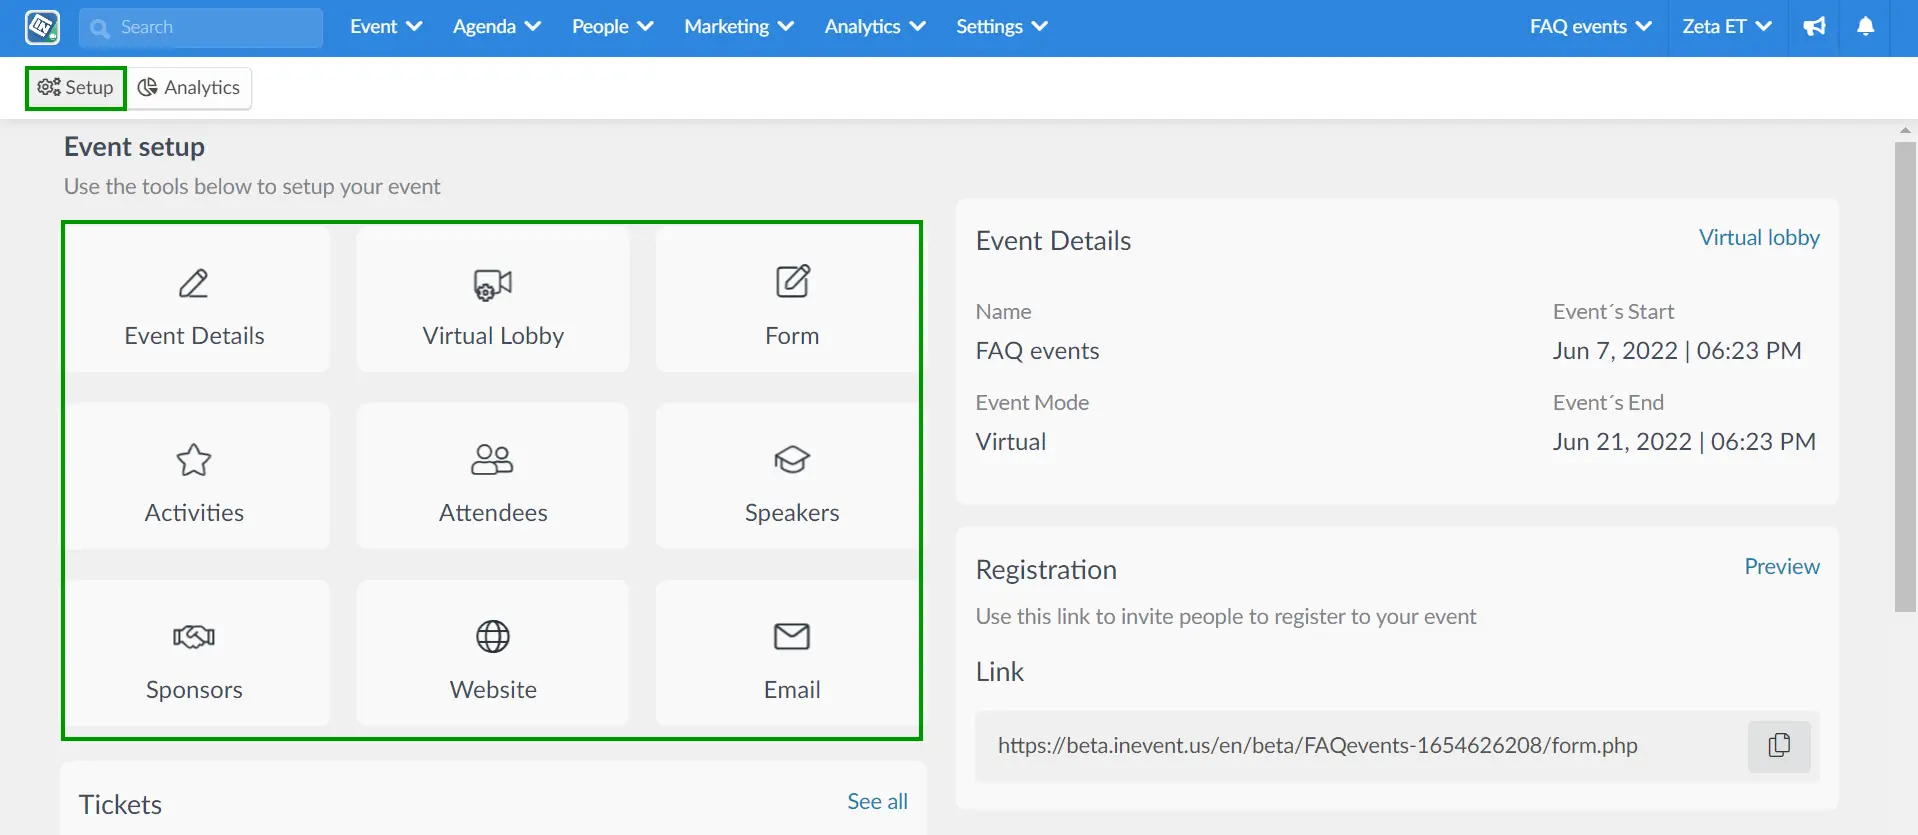
- Edit details: Update your event basic information
- Virtual Lobby: It takes to the Virtual Lobby setup page
- Form: Opens the registration form
- Activities: It accesses the schedules page
- Attendees: It directs to the Attendees' list
- Speakers: It takes to the Speakers' setup page
- Sponsors: It accesses the Sponsors' page
- Website: Get the link for the event website
- Email: Open the email builder
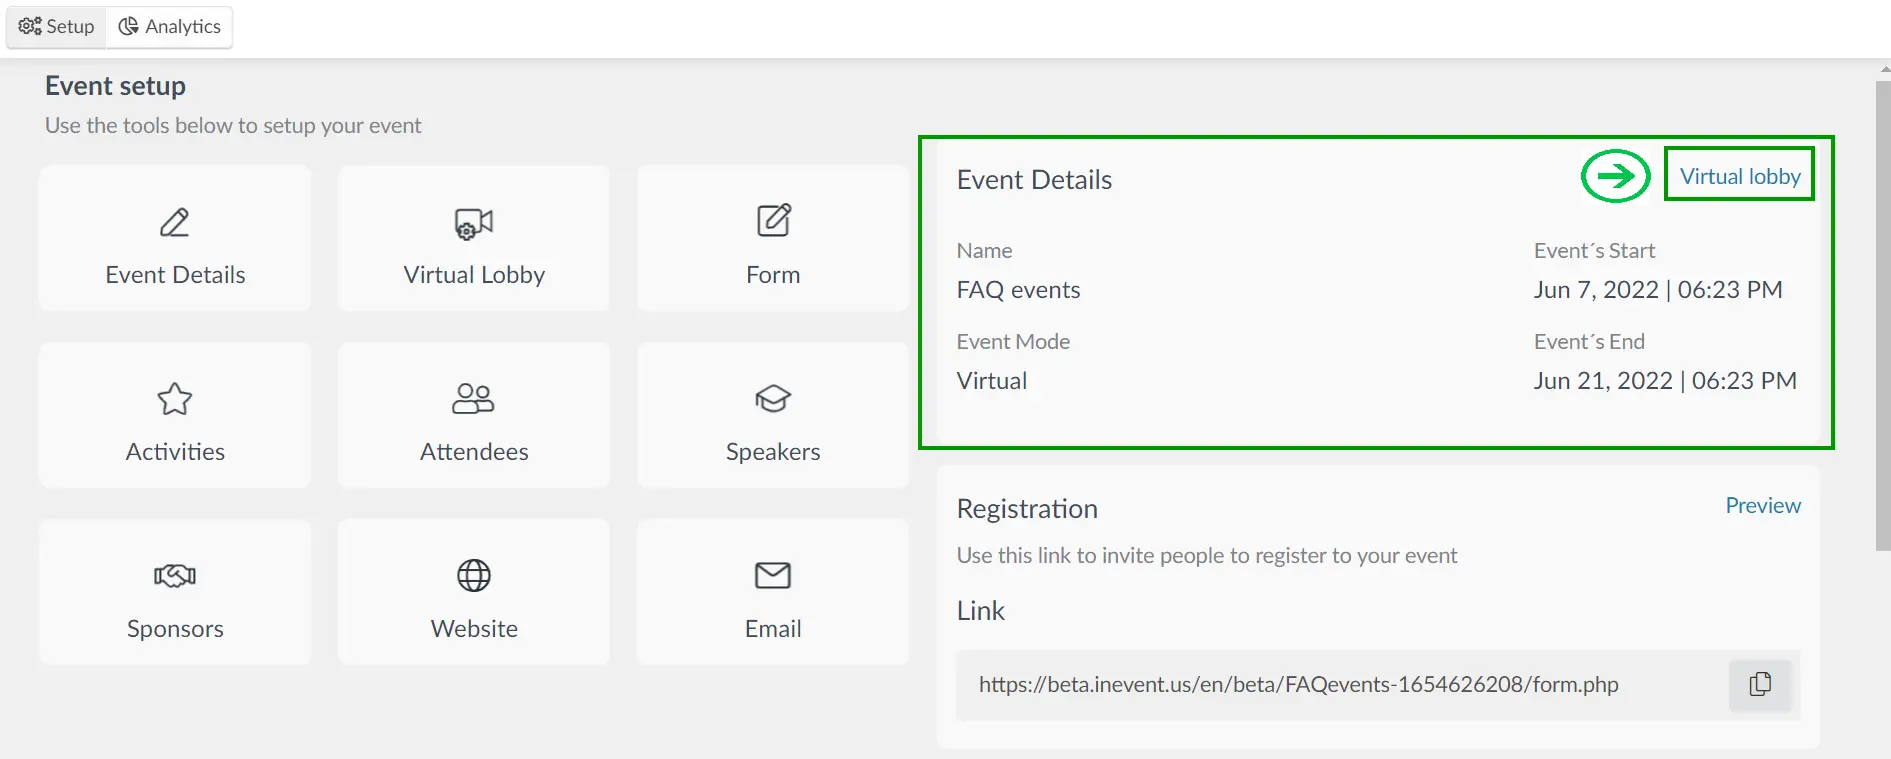
Event details
It displays the main details of the event such as Name, Event mode, and Event's start date/time as well as the Event's End date/time.
On the top right corner when clicking on Virtual Lobby, it opens the front end page of the Virtual Lobby.
Registration
It provides the link for the Registration/Purchase form and the Preview of the form.
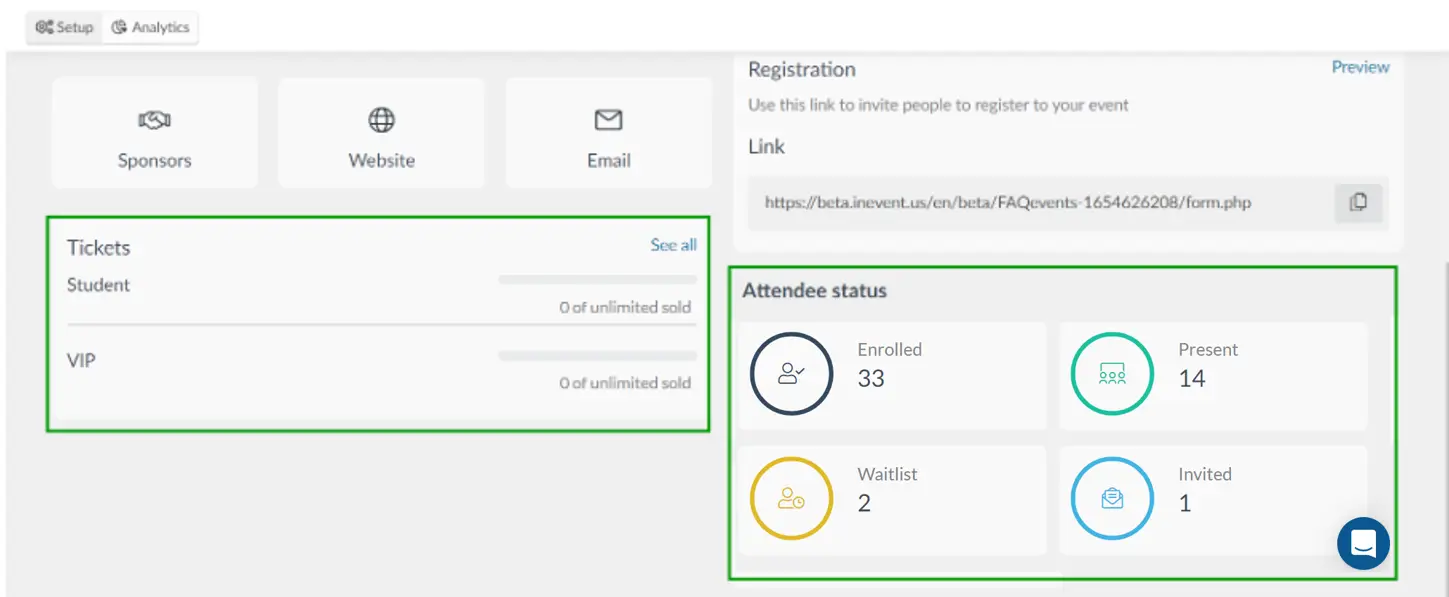
Tickets and Attendees
- In the Tickets area, you can find information related to the tickets created and how many tickets had been sold. If you click on See all it will open the payment dashboard page.
- The Attendee status box gives an overview of how many users are Enrolled, are on the Waitlist, are Invited and are Present.
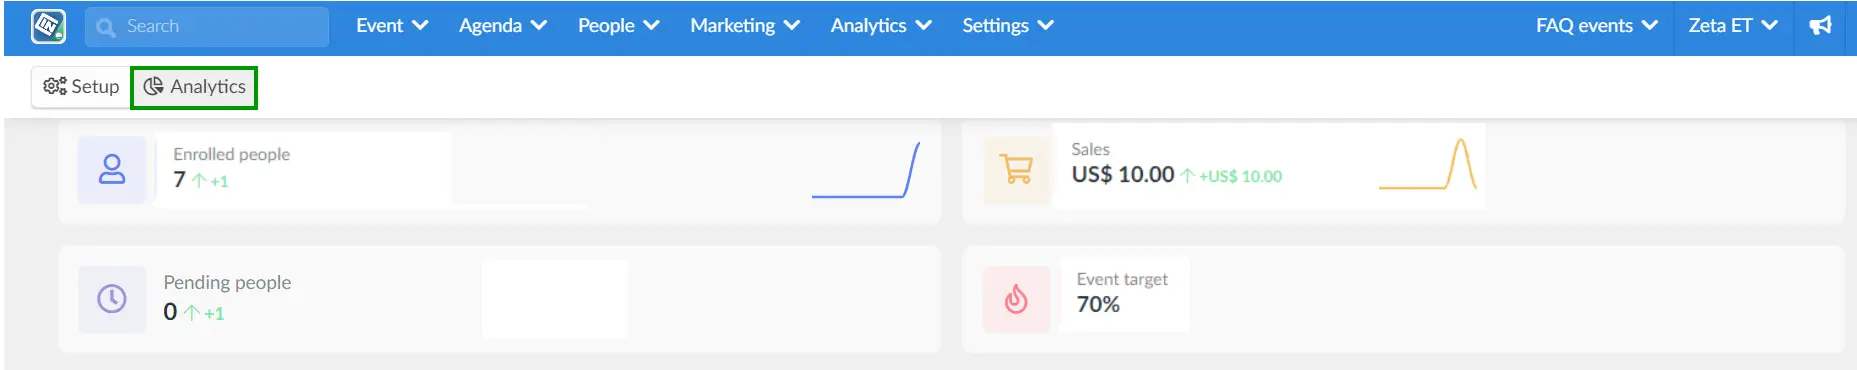
Analytics
- Enrolled people: it shows how many people are enrolled in your event, the number of people that have registered last week (green number), and a graphic that shows the number of registrations according to dates.
- Pending people: it shows how many people are pending approval on your waitlist, the number of pendencies last week, and also a graphic that shows the number of applications received according to dates, in case you have enabled the waitlist tool.
- Sales: it shows how much money you received by selling tickets, the amount related to last week (green number), and a graphic that shows the number of sales according to dates in case you have a ticket required event.
- Event target: it shows the percentage of attendees out of its capacity.
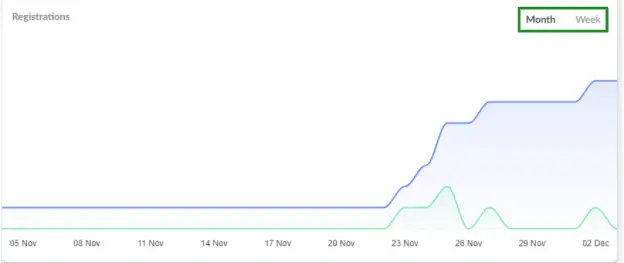
Registrations
Here you can visualize a graphic of the registrations over time in your event in either week or month view. The blue line represents the accumulated ones and the green line represents the entries.
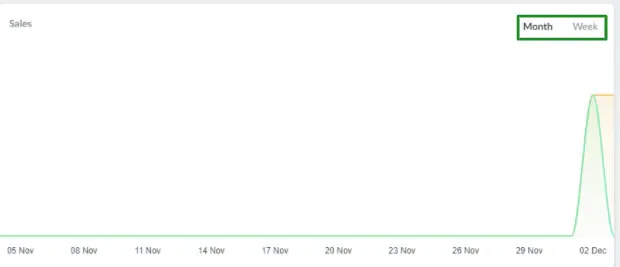
Sales
In this section, you can see the ticket sales over time that you have for this event, also in a week or month view. The yellow line represents the accumulated ones and the green line represents the actual sales.
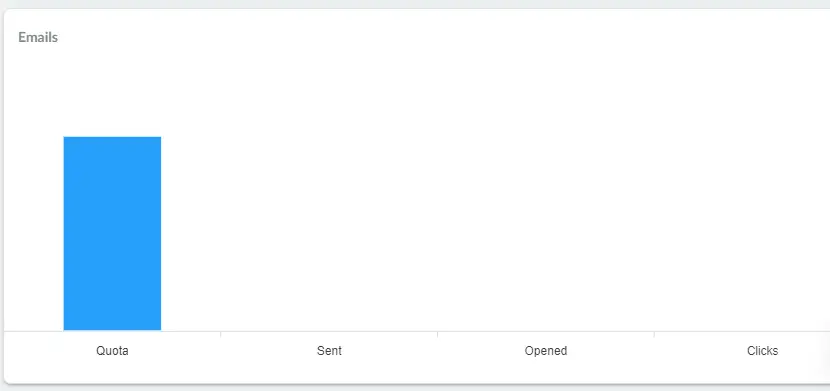
Emails
In this area you can see your email quota, sent, opened, and clicked emails that were delivered through the platform.
Click here for further information on email analytics.