Email Analytics
You can send automatic emails to applicants or attendees, and also personalized emails to participants and custom lists. Besides sending those emails, you'll be able to check how many emails have been sent out, the delivery rate, and the open rate and bounce rate as well.
This article intends to show you how to check and interpret email analytics.
How do I access the email analytics?
To do so:
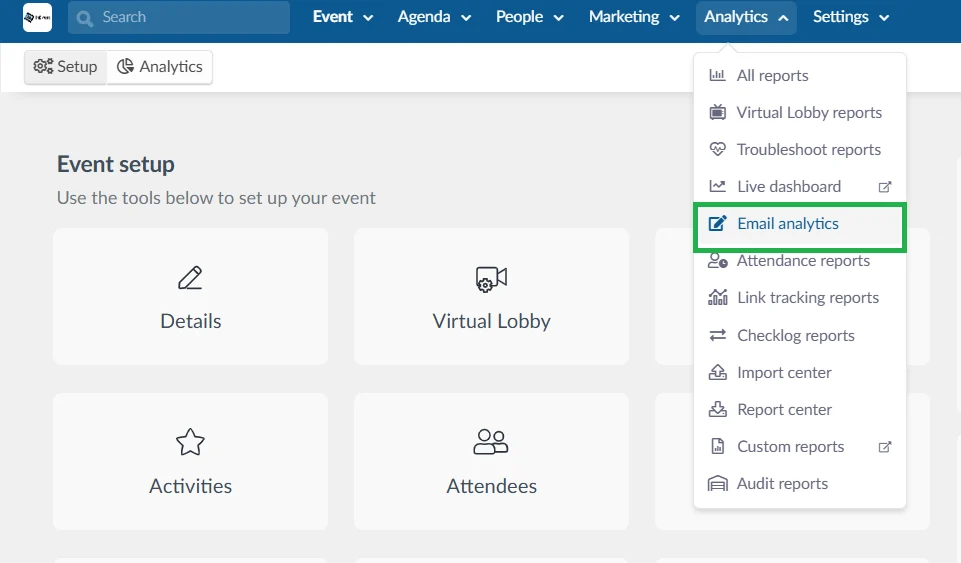
- Go to Analytics > Email analytics.
Overview
The main page contains an overview of the email analytics such as emails sent, delivery, bounce, open, click, and conversion rates.
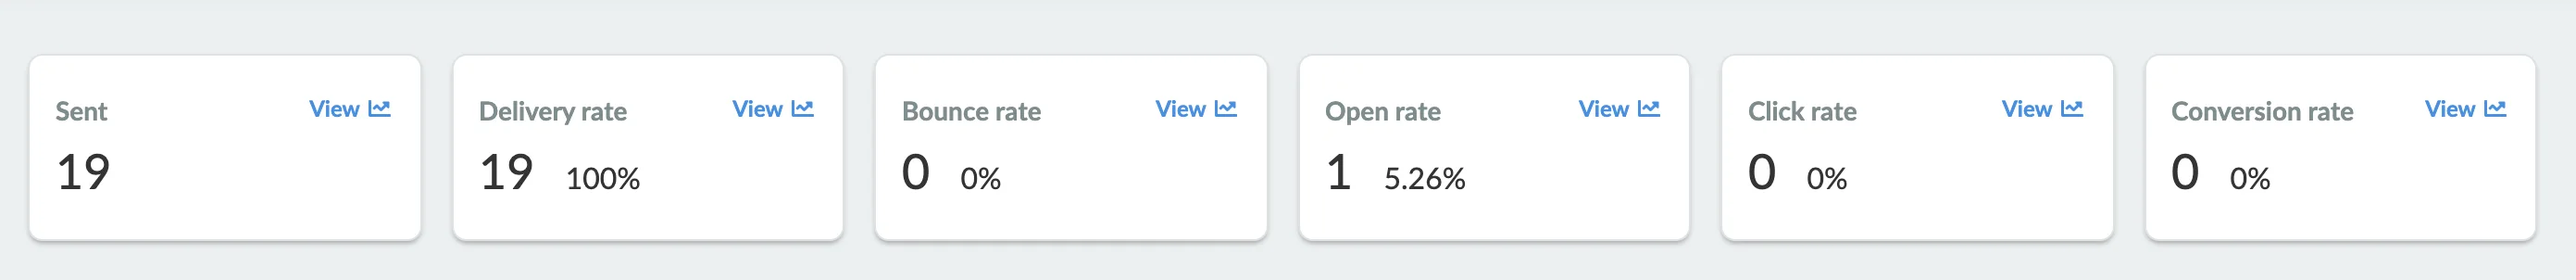
On each of those sections, if you press View you'll be able to check the following further information:
Sent: How many emails have been sent out, top 5 emails with most sends, and an email list ordered by sends.
Delivery rate: How many emails were delivered to its targets, delivered and bounced graphics, and an email list with bounces or spam complaints.
Bounce rate: The percentage of email addresses in your subscriber list that didn't receive your message because it was returned by a recipient mail server. You can also see the delivered and bounced graphics, and an email list with bounces or spam complaints. Click here to learn how to reduce your bounce rate.
Open rate: The percentage of your audience that opened the emails you sent, and a list of emails with the highest open rates.
Click rate: A percentage that tells you how many successfully delivered emails got at least 1 click, and a list of emails with the highest click rates.
Conversion rate: It refers to the percentage of subscribers who completed the desired action. For example, if you add a registration form link, it will count how many people completed their registration converting from an invitee to an attendee. You can see a list of emails with the highest conversion rates as well.
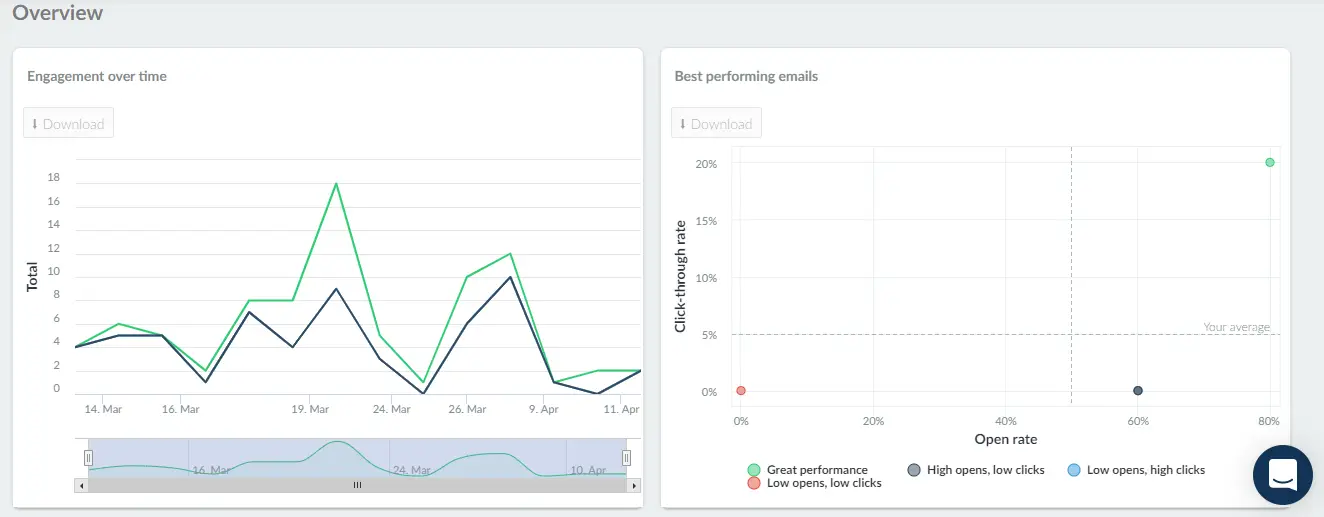
Engagement and best performing emails
You can see the engagement over time and also your best-performing emails through downloadable charts.
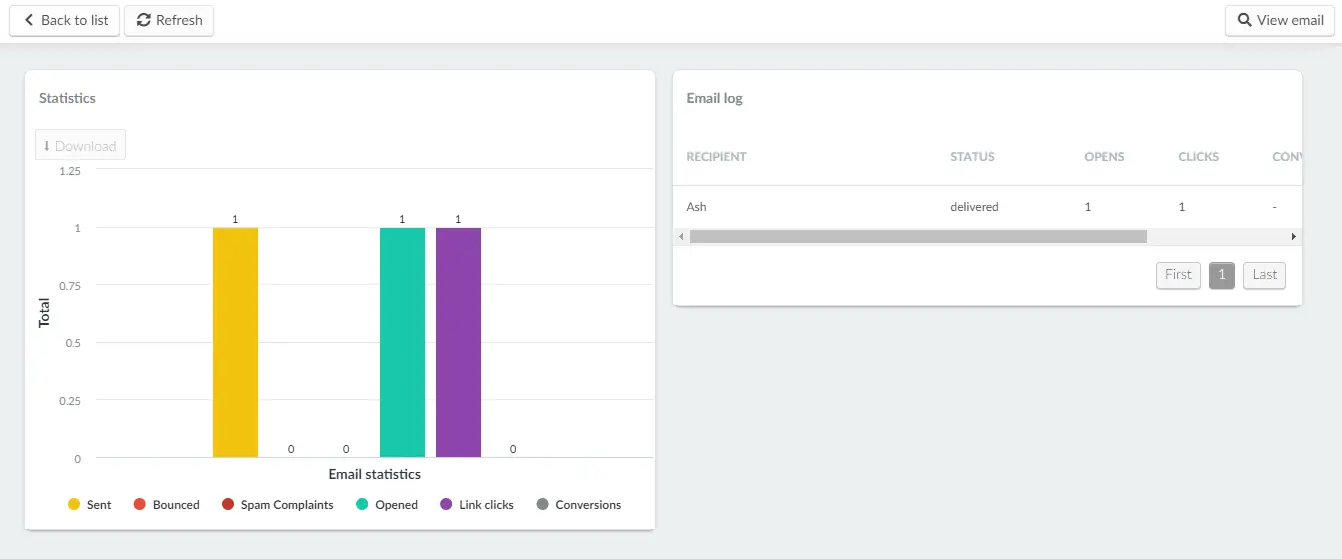
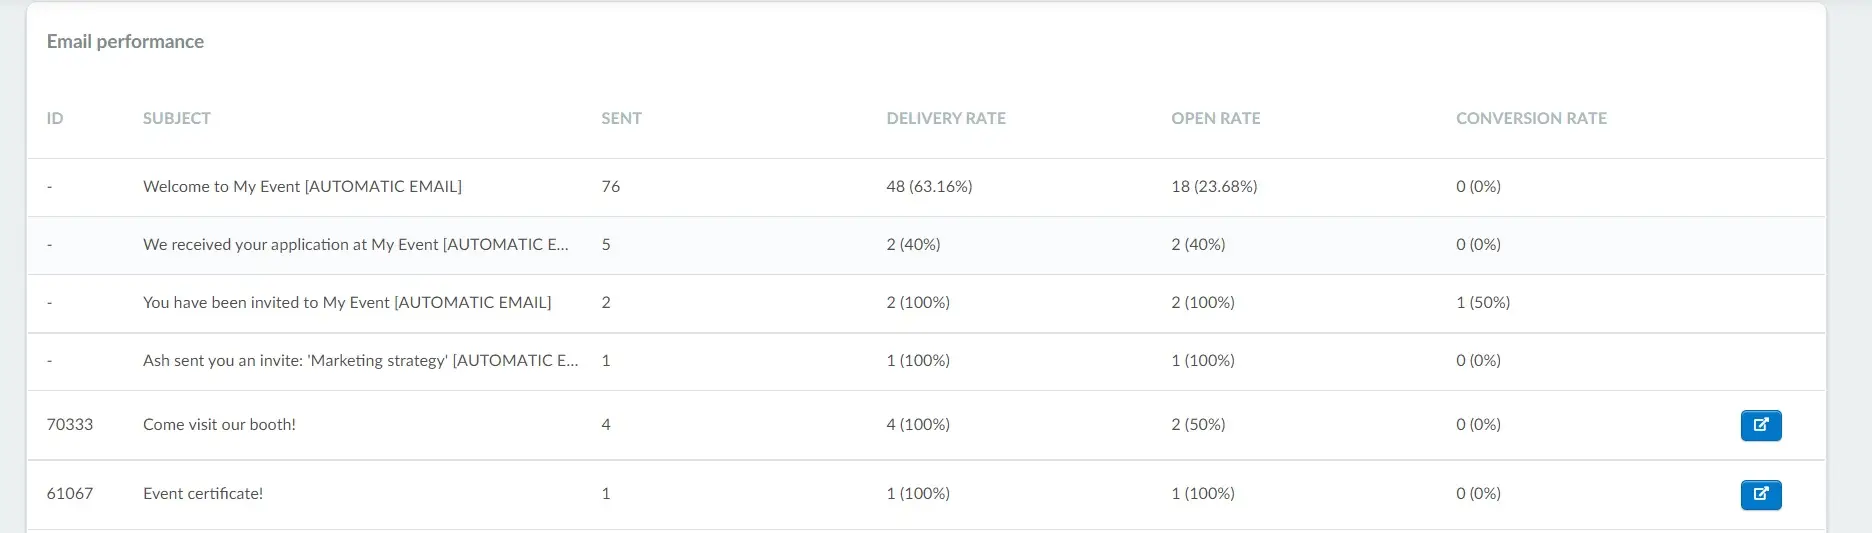
Email performance: check the analytics for one specific email
If you would like to check the analytics for one specific email, scroll down the page until you see the section Email performance.
Select the email you'd like to analyze and click on the blue button on the right side of the screen to open more details.
You will be taken to a new page where you'll be able to see email logs and statistics such as who opened your emails and how many clicks each link got, spam complaints, and conversions your email had.