AI-powered Custom Reports
 Updated 1 month ago
by
Amalia
Updated 1 month ago
by
Amalia
InEvent understands that event organizers have verying needs for reporting event statistics. To accommodate those needs, InEvent offers an AI-powered Custom Reports feature to assist event organizers in creating reports of events and webinars with ease.
Accessing the Custom Reports overview
The Custom Reports overview can be accessed by clicking Reports > Custom Reports within the Company level.
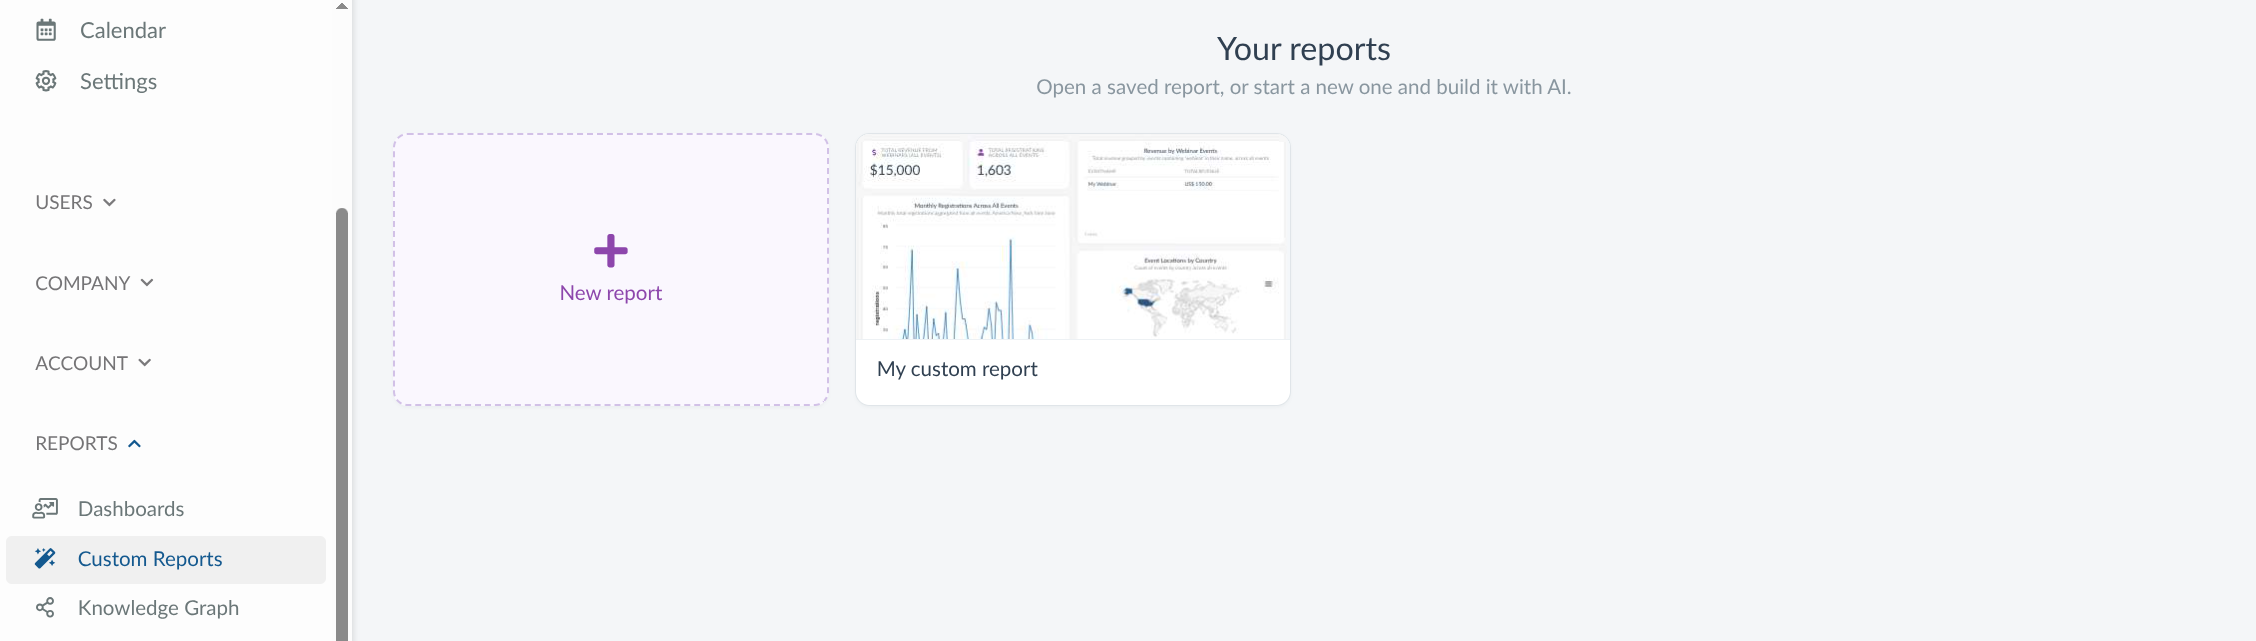
New Custom Reports can be created from within this page. Existing saved reports will also be displayed here.
Allowing viewing and visualization of Custom Reports using customized permissions
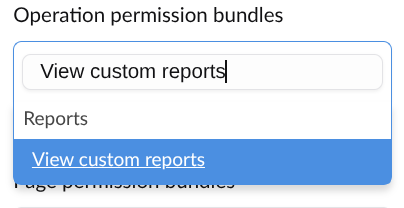
Company users can be given custom permissions to access, view, and visualize AI-powered Custom Reports. To do so, add the View custom reports operation permission bundle to a new or an existing permissions profile at the Company level.
Allowing Custom Report creation by administrators
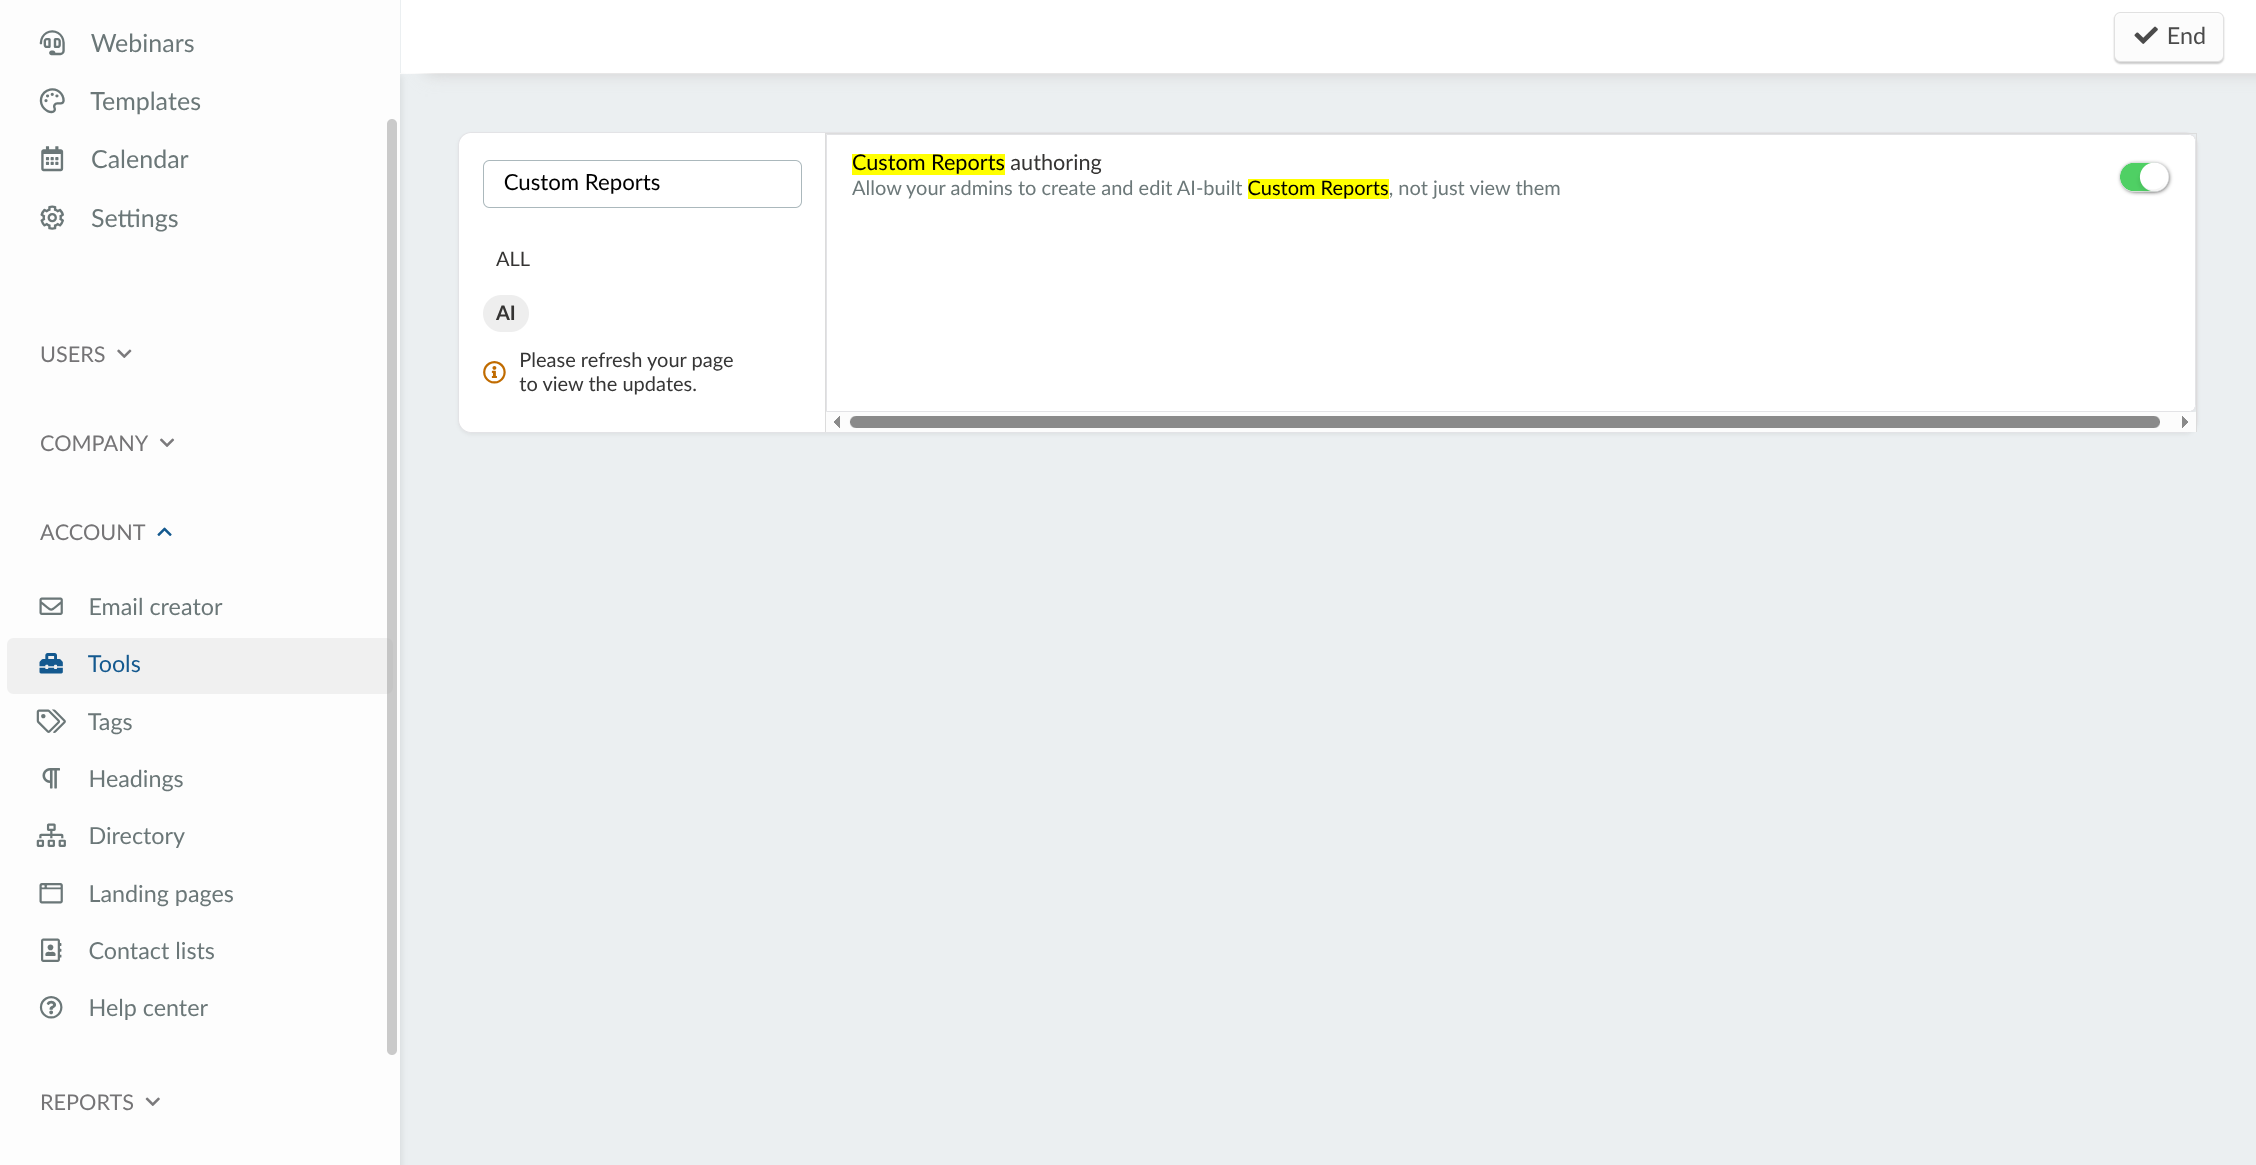
To allow administrators to create Custom Reports, and not just view them, ensure to enable the Custom Reports authoring tool within Company Tools.
Custom Report creation
To start the Custom Report creation process, click New report within the Custom Reports overview. Doing so will display the following Custom Reports interface, which consists of the AI Assistant, Filters panel, and Custom Reports dashboard.
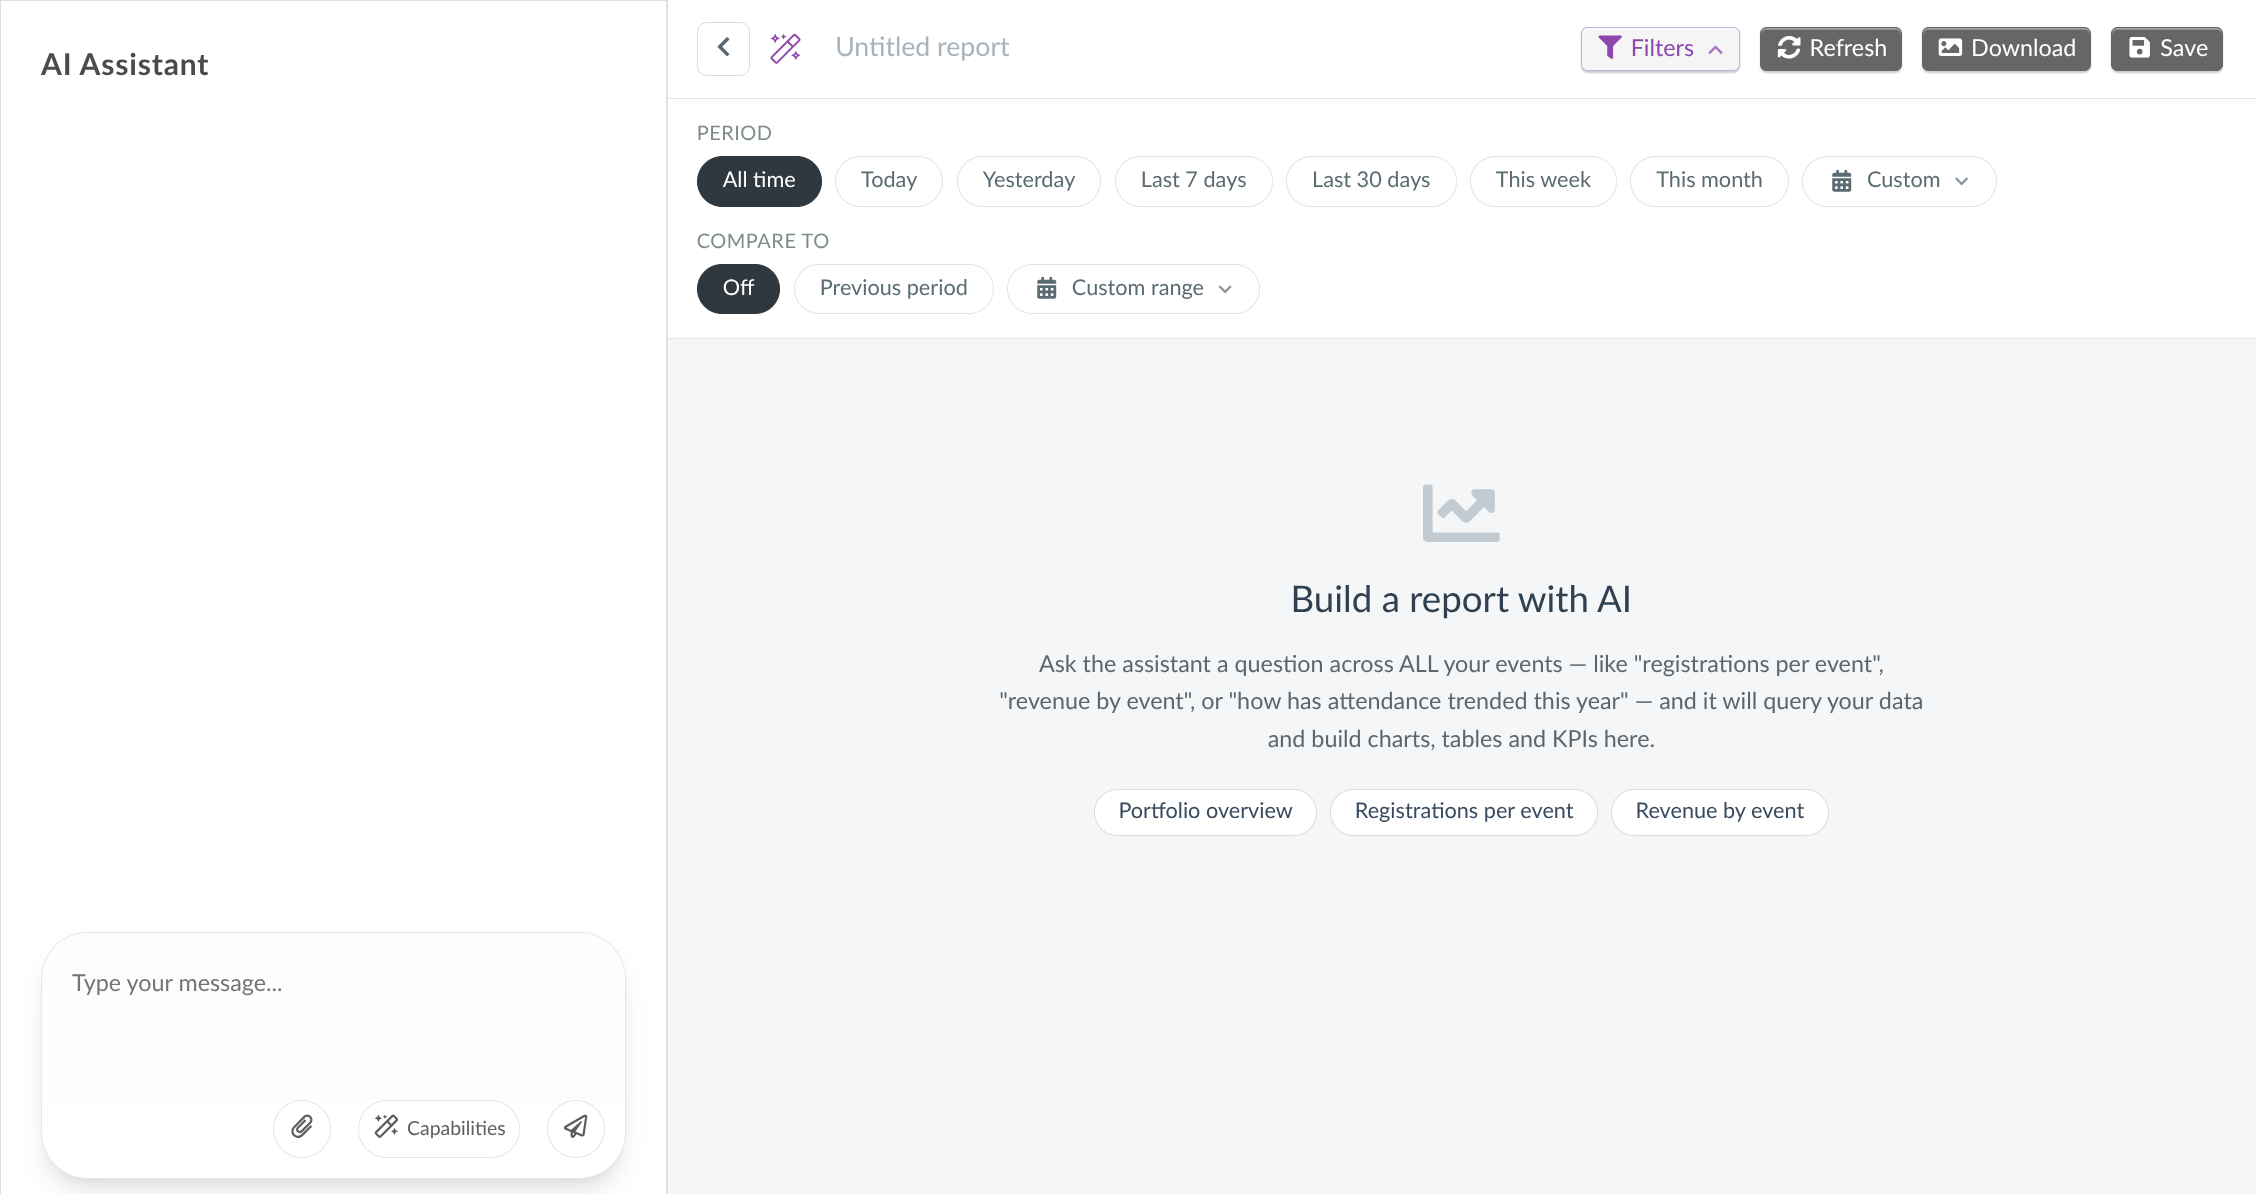
AI Assistant
Event organizers operate the AI-powered Custom Reports feature by providing instructions and details to the AI Assistant. Enter your instructions and details as a prompt within the text box and click the Send button, or press the Enter key on your keyboard. Then, simply wait for the AI Assistant to process your prompt. Once the process is done, the results will be displayed on the Custom Reports dashboard area.
Below is an example of generating a revenue report.
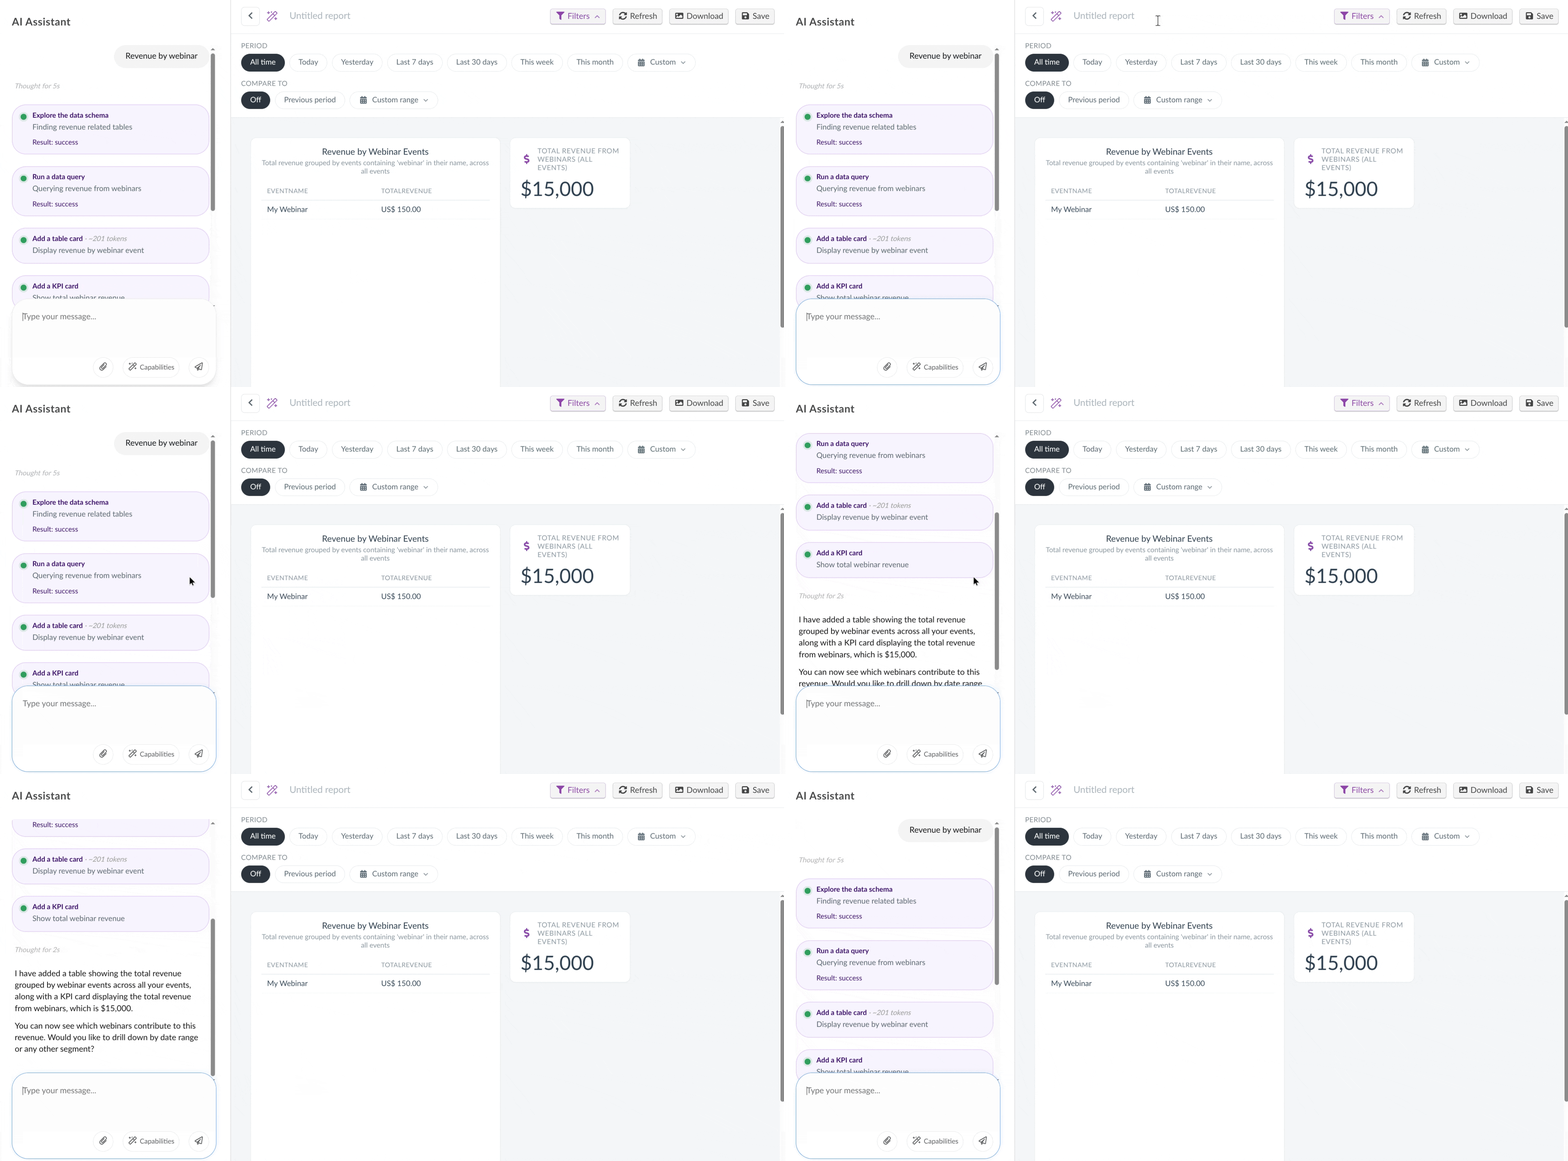
You can also attach an image file to a prompt by clicking the Attach images button.
AI Assistant capabilities
The Capabilities button displays a list of actions that can be performed by the AI Assistant. The AI Assistant will evaluate your prompt and find the best match to fulfill your needs based on your prompt, so for best results, ensure to specify the type of information and which presentation form you desire.
The actions are as follows.
Action | Description |
Explore the data schema | Looks at what event data is available to report on |
Run a data query | Queries the event data |
Add a KPI card | Adds a key-metric card to the dashboard |
Add a chart card | Draws a chart on the dashboard |
Add a map card | Draws a geographic map on the dashboard |
Add a table card | Adds a data table to the dashboard |
Add a note | Adds an explanatory note to the dashboard |
Clear the dashboard | Clears the dashboard |
List dashboard cards | Checks what is on the dashboard |
Remove a card | Remove a card from the dashboard |
Update a card | Updates a card on the dashboard |
Filters panel
The Filters panel provides options for specifying periods of reported data as well as periods of comparison.
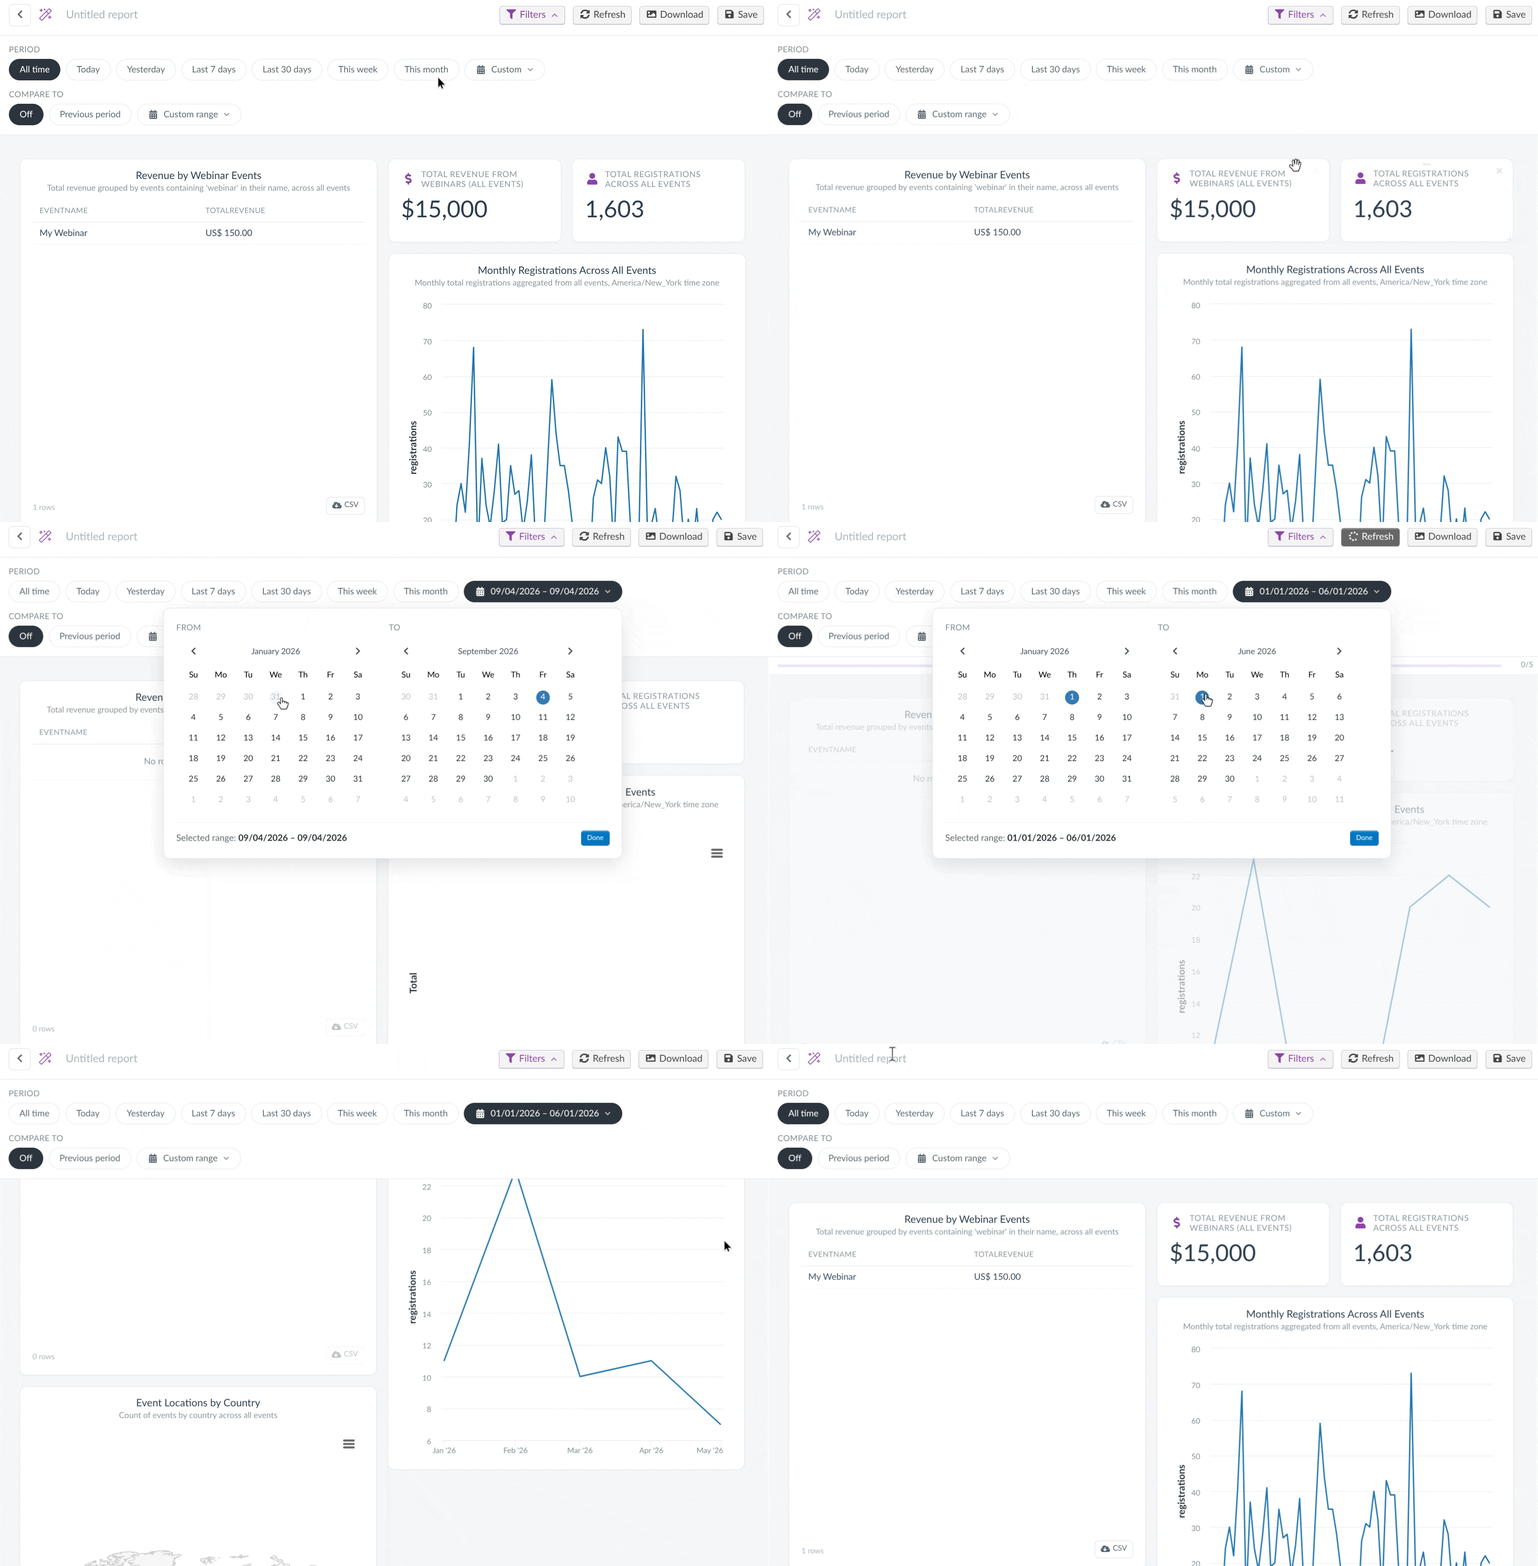
You can select from the standard Periods of reported data, including All time, Today, Yesterday, Last 7/30 days, This week, and This month. You can also use the Custom date selector and specify your desired start date and end date.
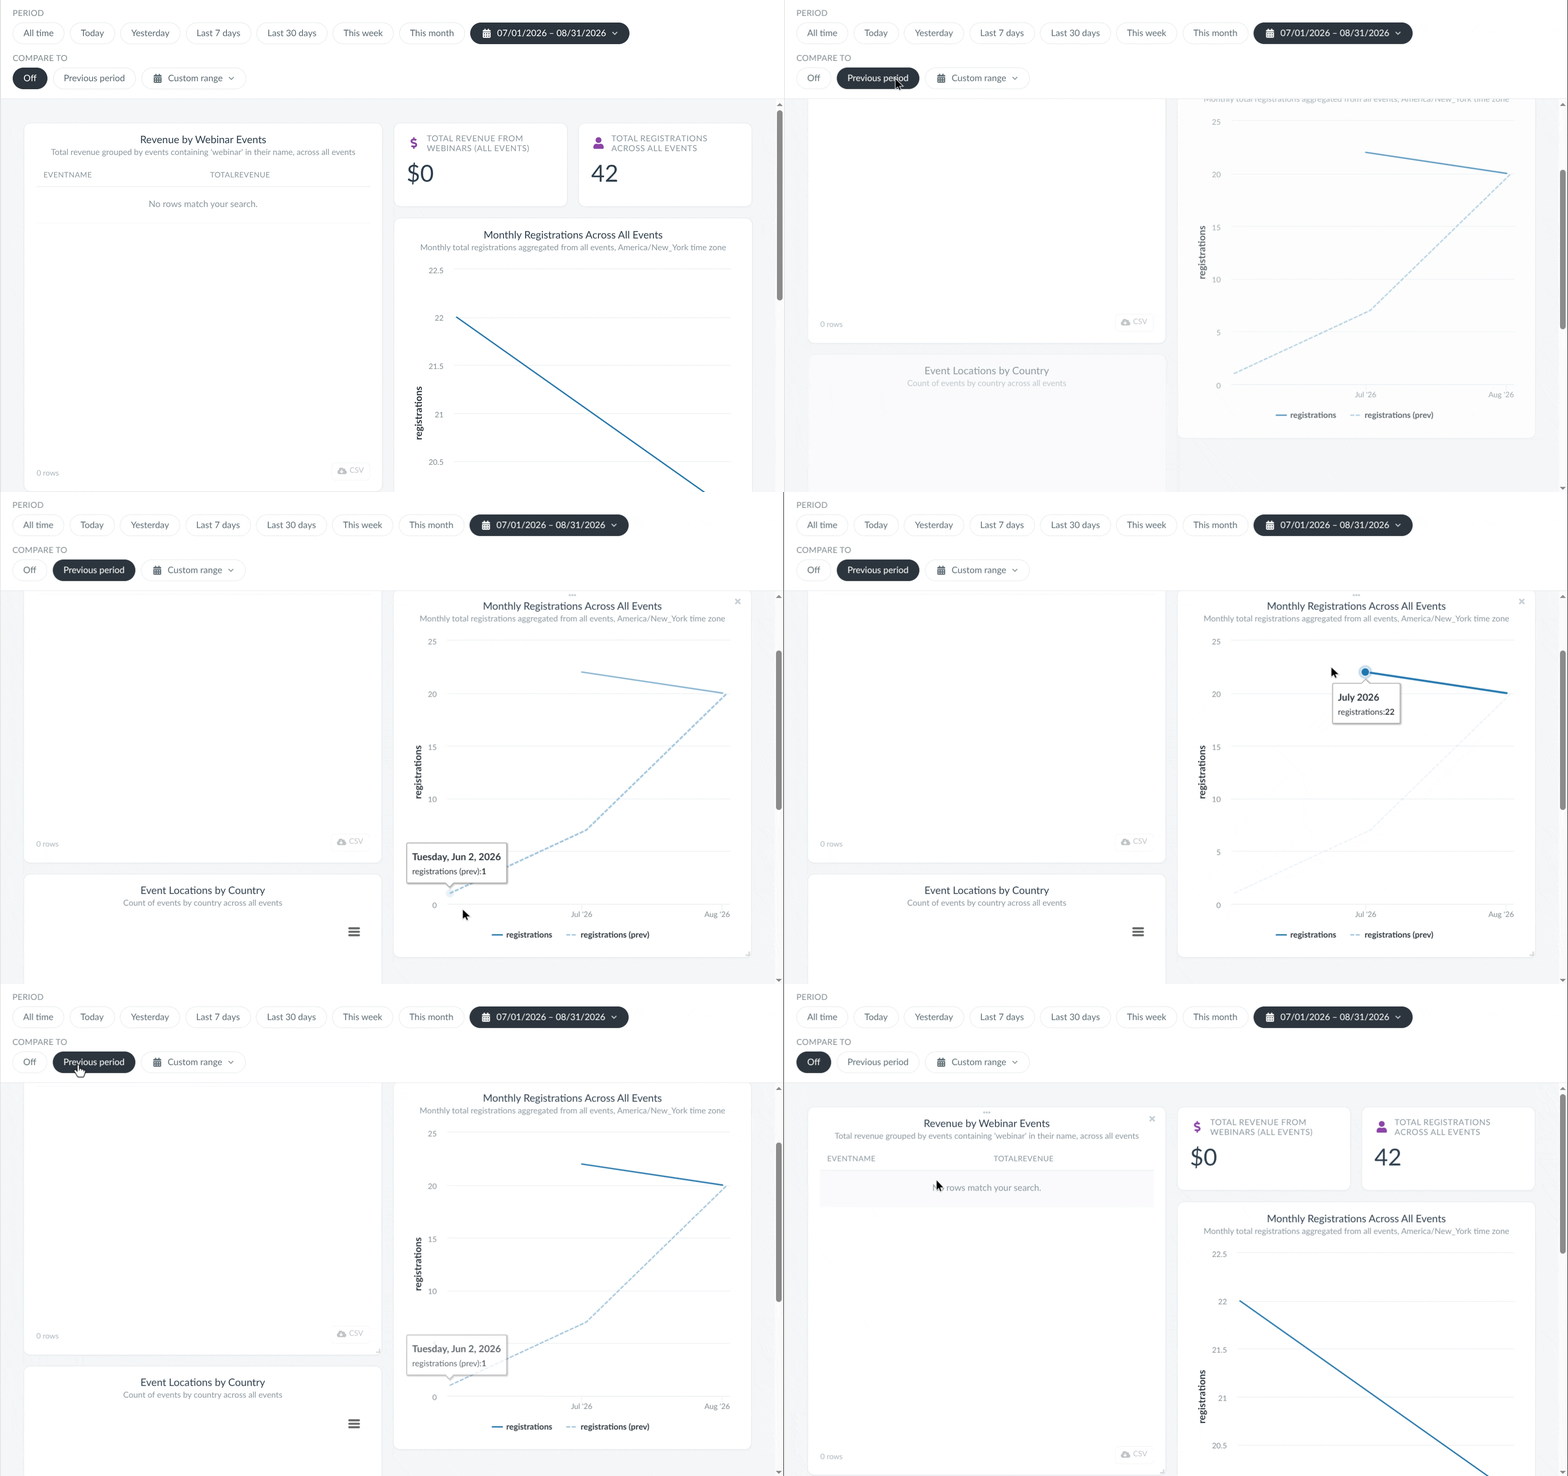
The Compare to options facilitate a quick viewing of comparison data. This compares the data in the specified period with that of the previous period, then displays the difference. Below is an example of comparing registrations between the specified period and the previous period.
The Filters panel can be hidden by pressing the Filters button on the top panel.

Custom Reports dashboard
The Custom reports dashboard is where all AI Assistant-generated report cards are displayed.
Setting a title for the Custom Report
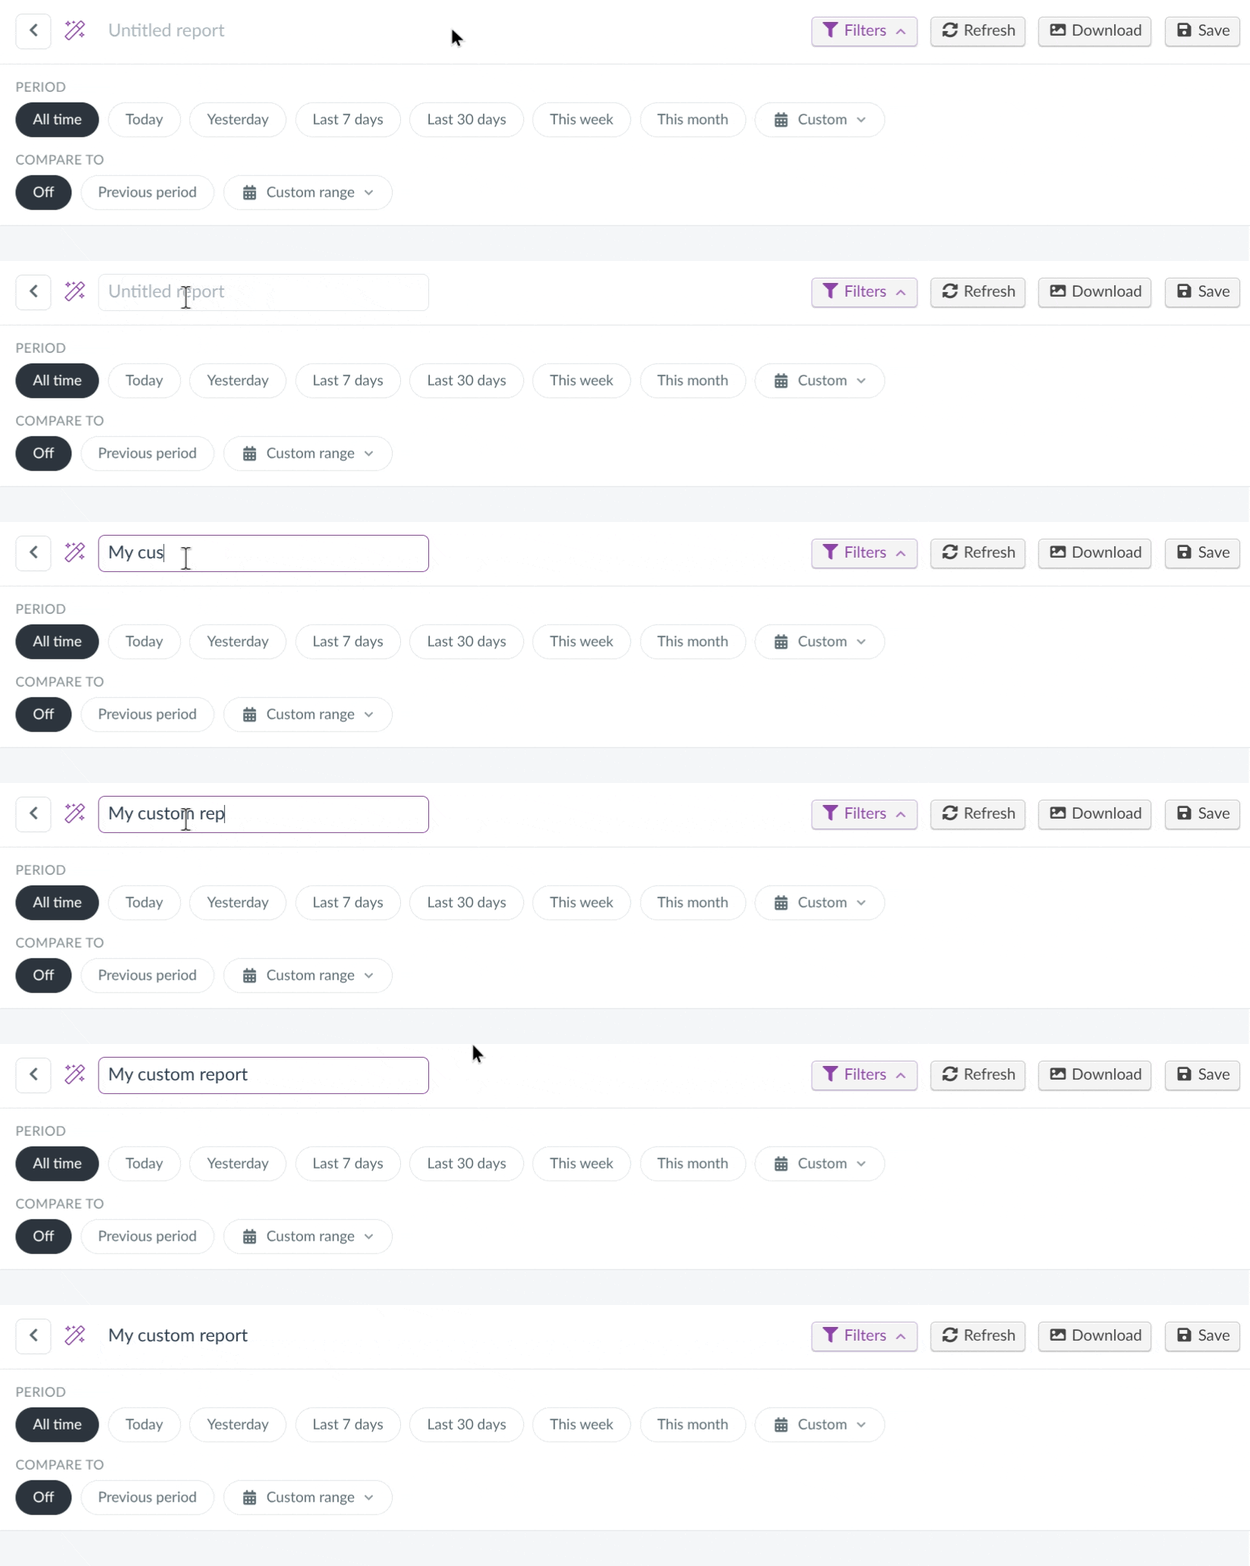
Ensure to set a title or name for your report by typing the title into the text bar on top of the page.
Refreshing the contents of the Custom Report
The Refresh button triggers a data refresh to ensure all data is up to date.
Downloading the Custom Report
The Download button saves your Custom Report cards as an image file and downloads it in a PNG format, following the placement and size settings on the dashboard.
Saving the Custom Report
The Save button saves your Custom Report and ensures all cards, including its contents, placement, and size, are preserved in the platform.
Organizing report cards
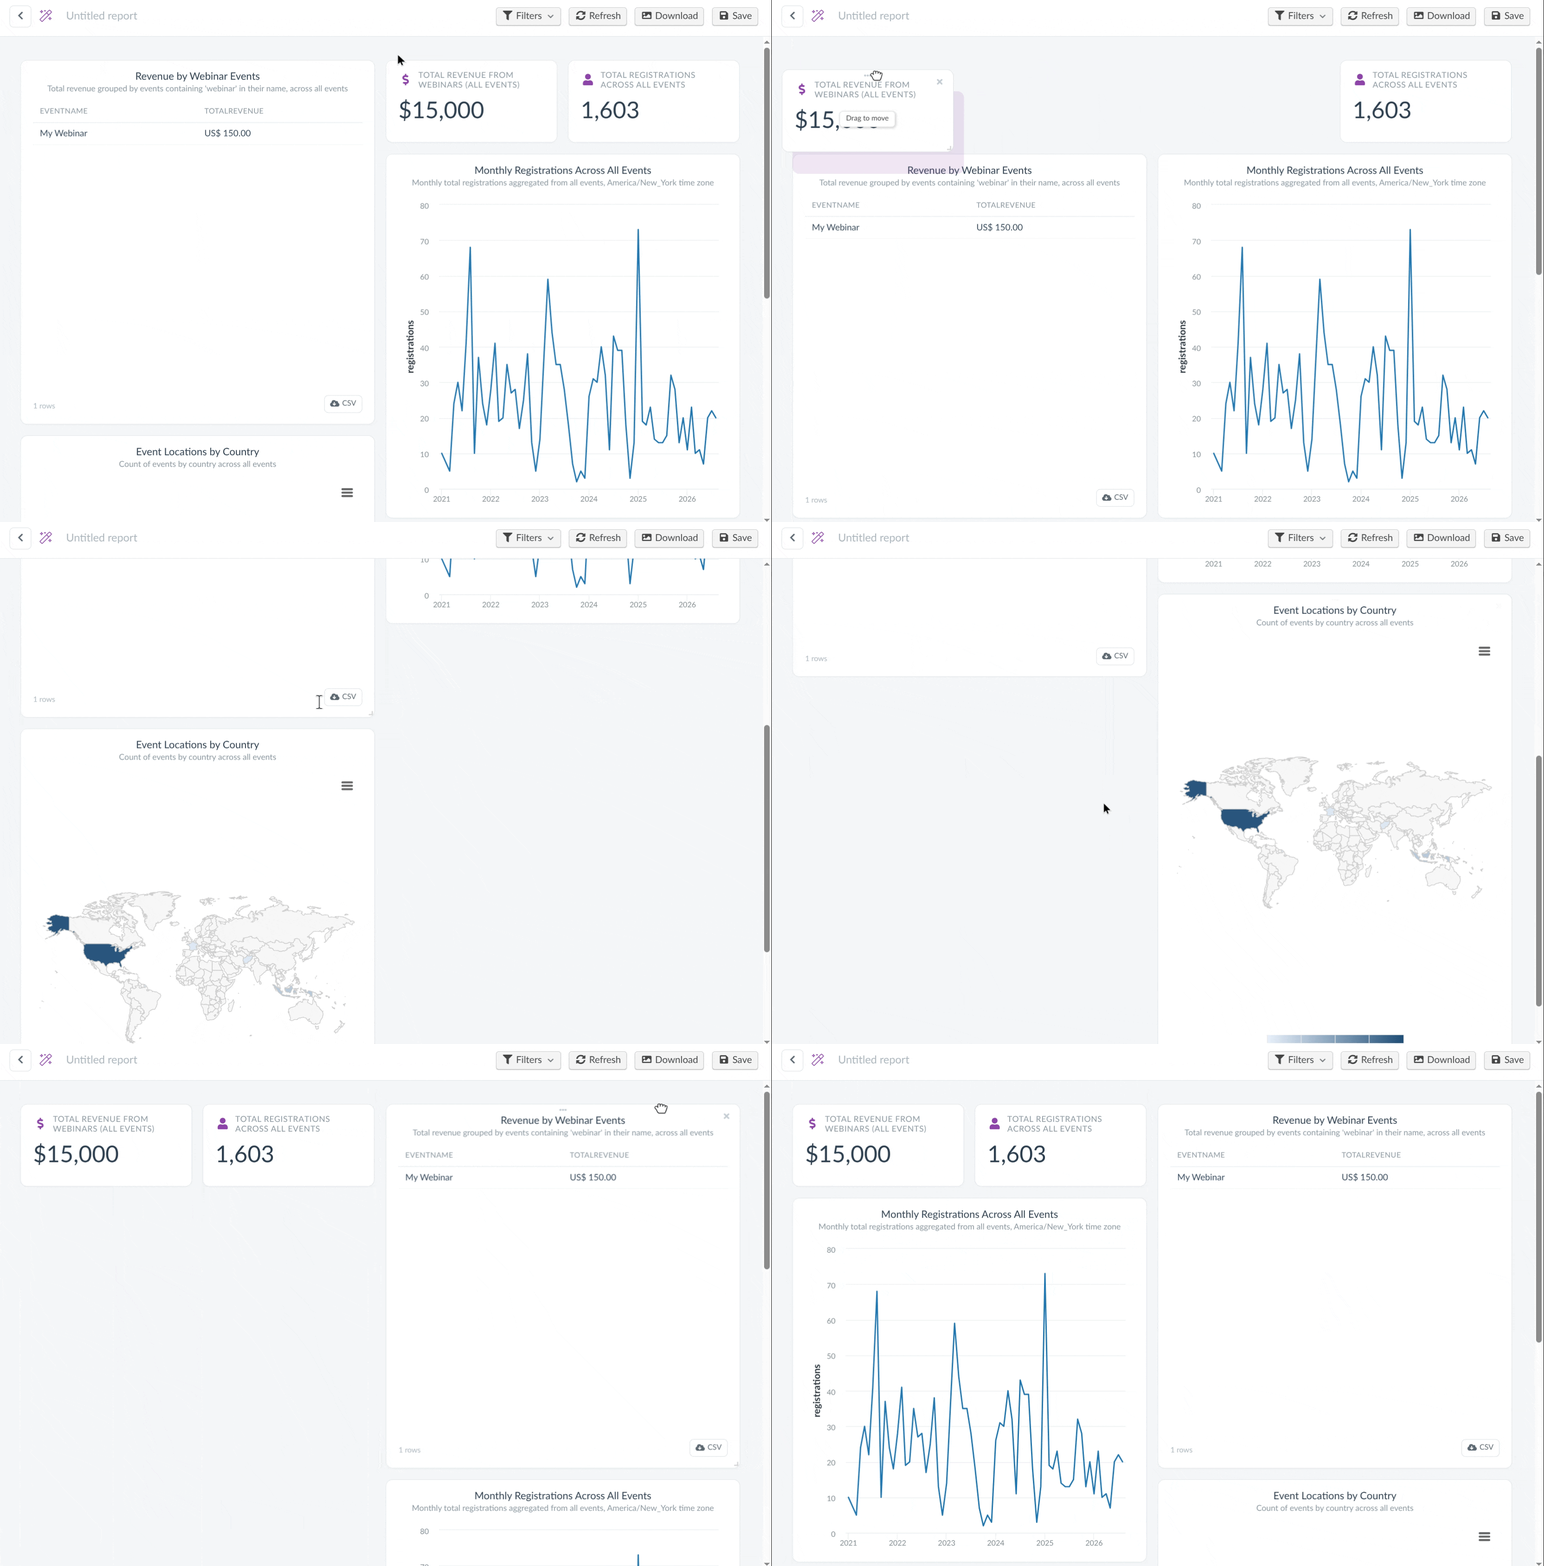
All report cards in the dashboard can be dragged and dropped for easy organization for your ease of viewing.
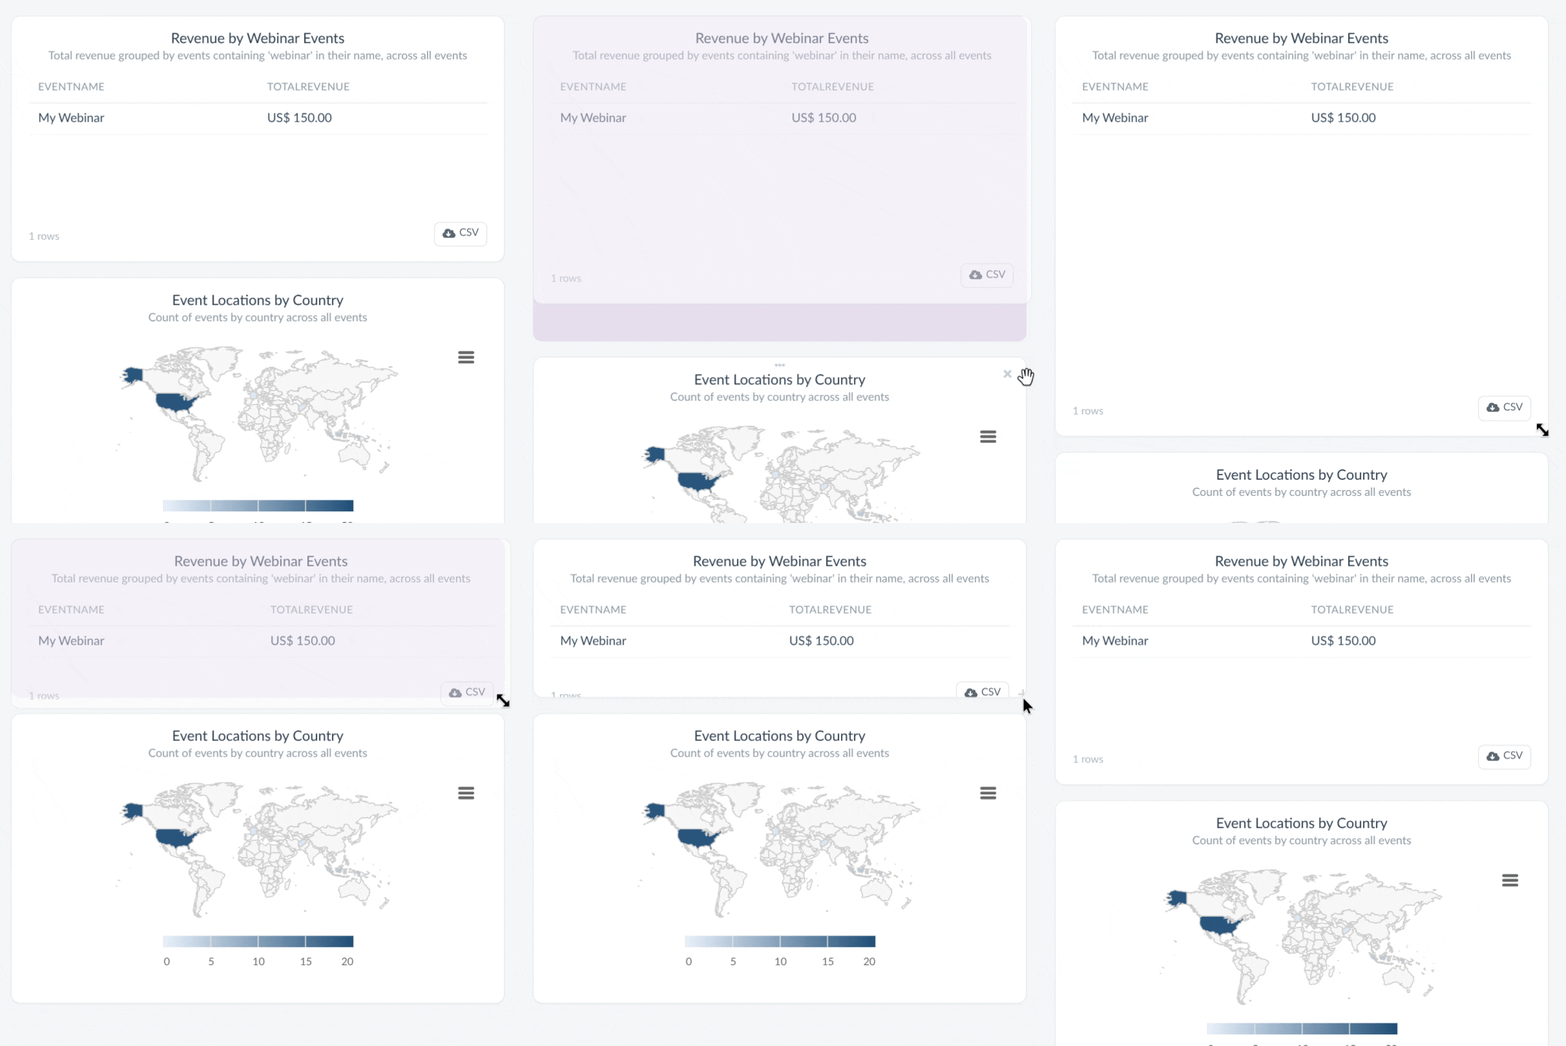
Click and drag the bottom right corner of a card to adjust its block size.
Removing report cards
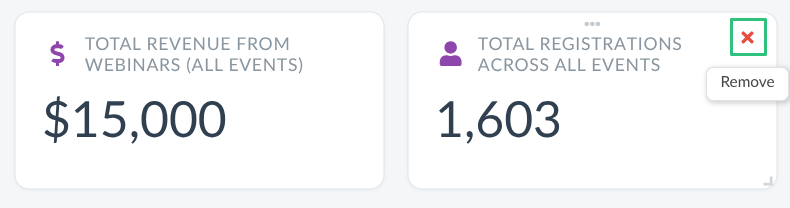
All report cards in the dashboard can be manually removed or deleted by clicking the Remove button on the top right corner of each card.
Downloading report card contents
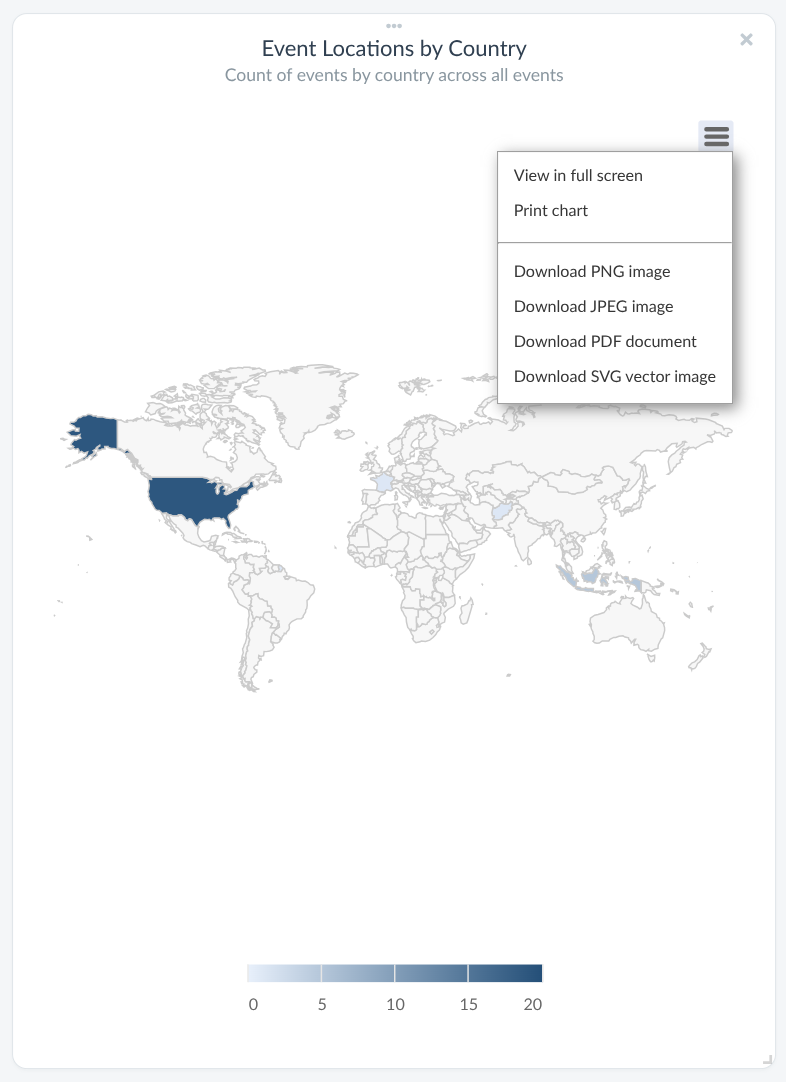
Certain report card types can be saved and downloaded to your computer in its respective formats. For example, a geographic map report card can be saved as image files of varying formats, in addition to being viewable as a full-screen display and being directly printable.
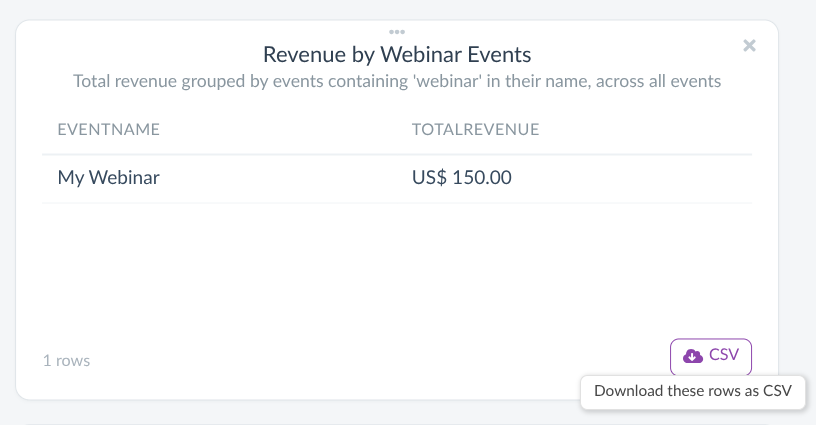
Another example is a table card, which can be downloaded as a CSV file format.