Virtual Lobby reports
 Updated 4 months ago
by
Faisal Durrani
Updated 4 months ago
by
Faisal Durrani
In the Virtual Lobby reports, you will be able to see how many of your sessions were viewed, who viewed them, and for how long.
This article intends to draw out what you will find in the Virtual Lobby reports, as well as how to analyze and extract this data from the platform.
Accessing the Virtual Lobby reports
To find your Virtual Lobby analytics, go to Analytics > Virtual Lobby reports.
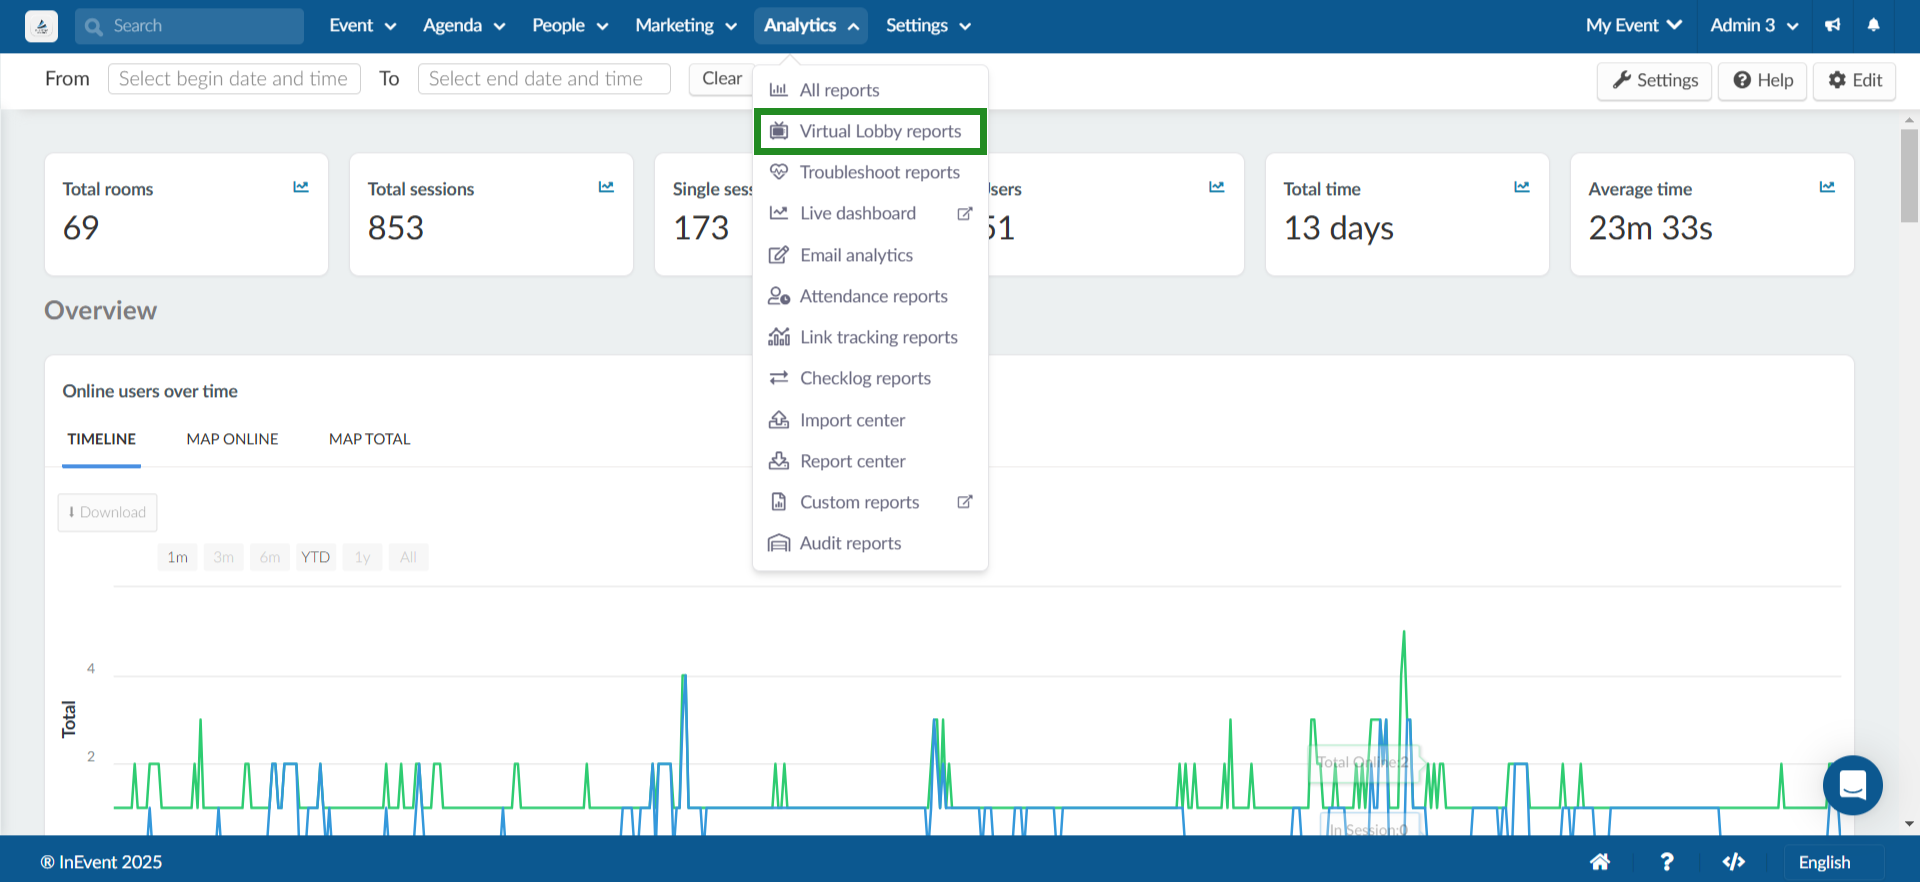
The main page contains general data and an overview of the analytics. Here you will find the number of online users over time and your live performances listed.
In addition, you can also filter the reports on the Virtual Lobby reports page to only show data from a specific date and time range using the date selector on the top left corner. Once you have selected a date and time range, the page will be automatically updated. To remove the filter, simply click Clear beside the date selector.
General data
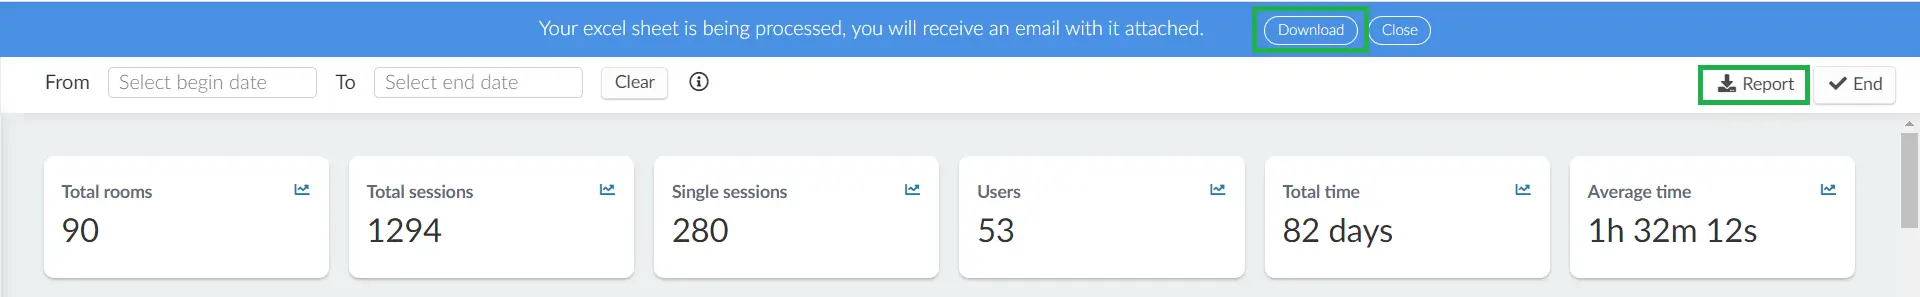
At the top of the page, you will find six boxes with general information about the event:
- Total Rooms - Counts how many rooms have been created in the Virtual Lobby. This includes activities, sponsor booths, meetings, and group rooms.
- Total sessions - Counts the total amount of times people have joined the room (for example if they have entered, left, then re-entered)
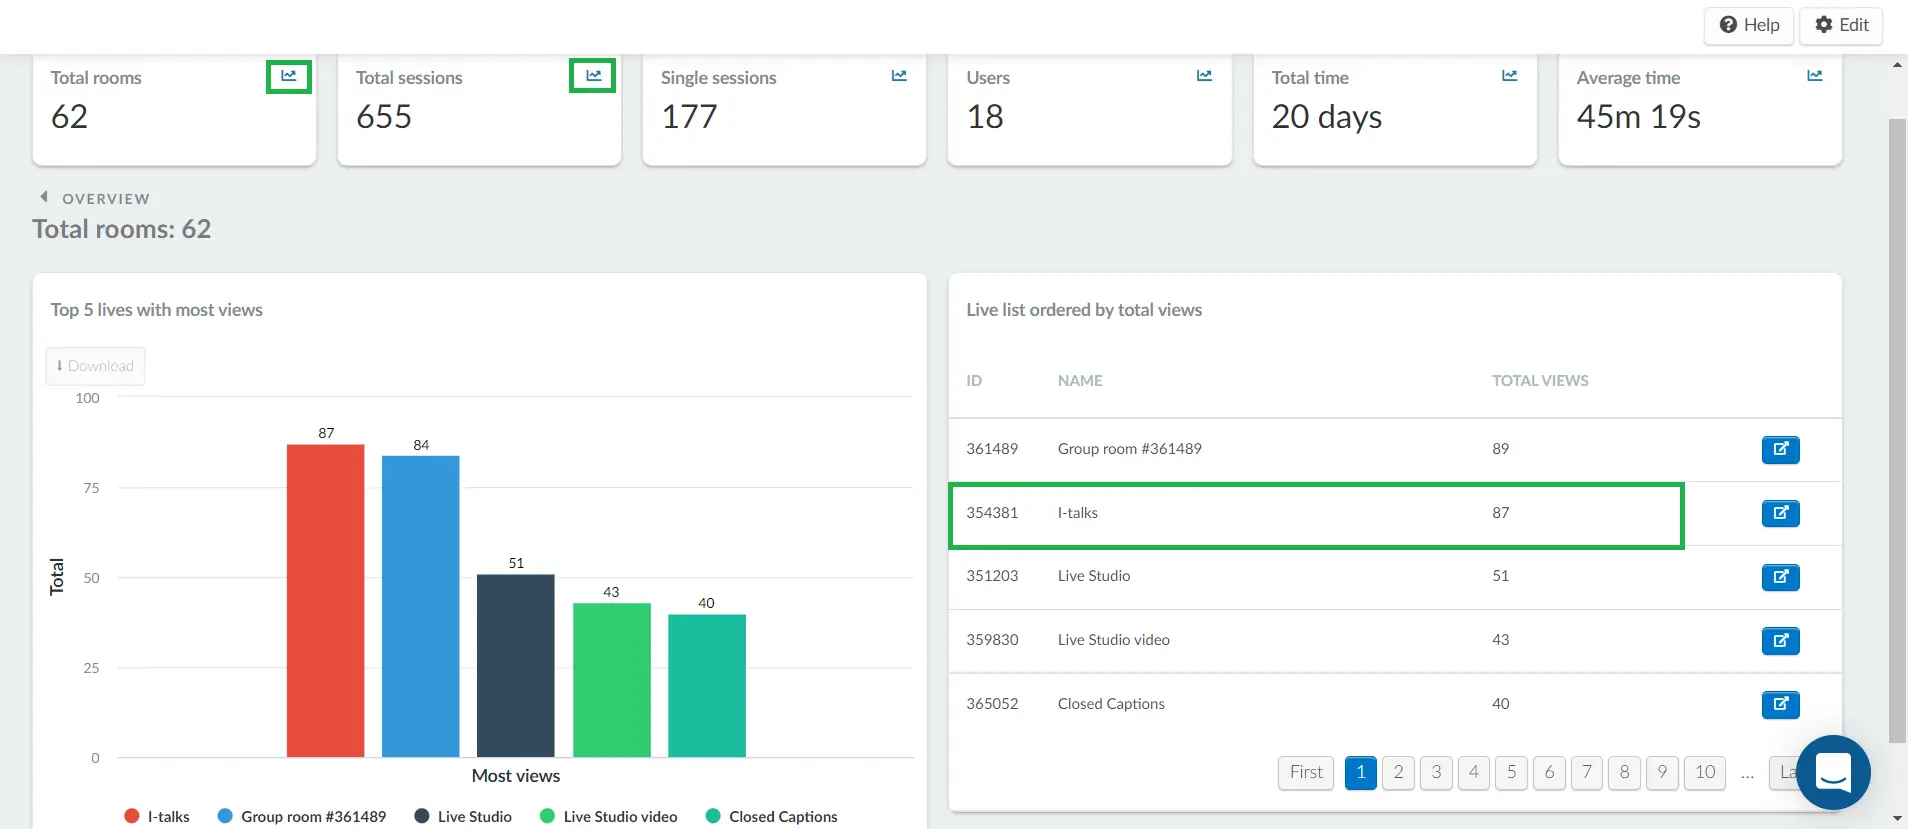
If you click View on the top right corner of the Total rooms and Total Sessions boxes, you will see a live list of all rooms created ordered by total views.
As shown in the image below, there are 62 rooms in the Virtual Lobby, people have joined those rooms 655 times and the I-talks session comprises 87 views out of the 655 views.
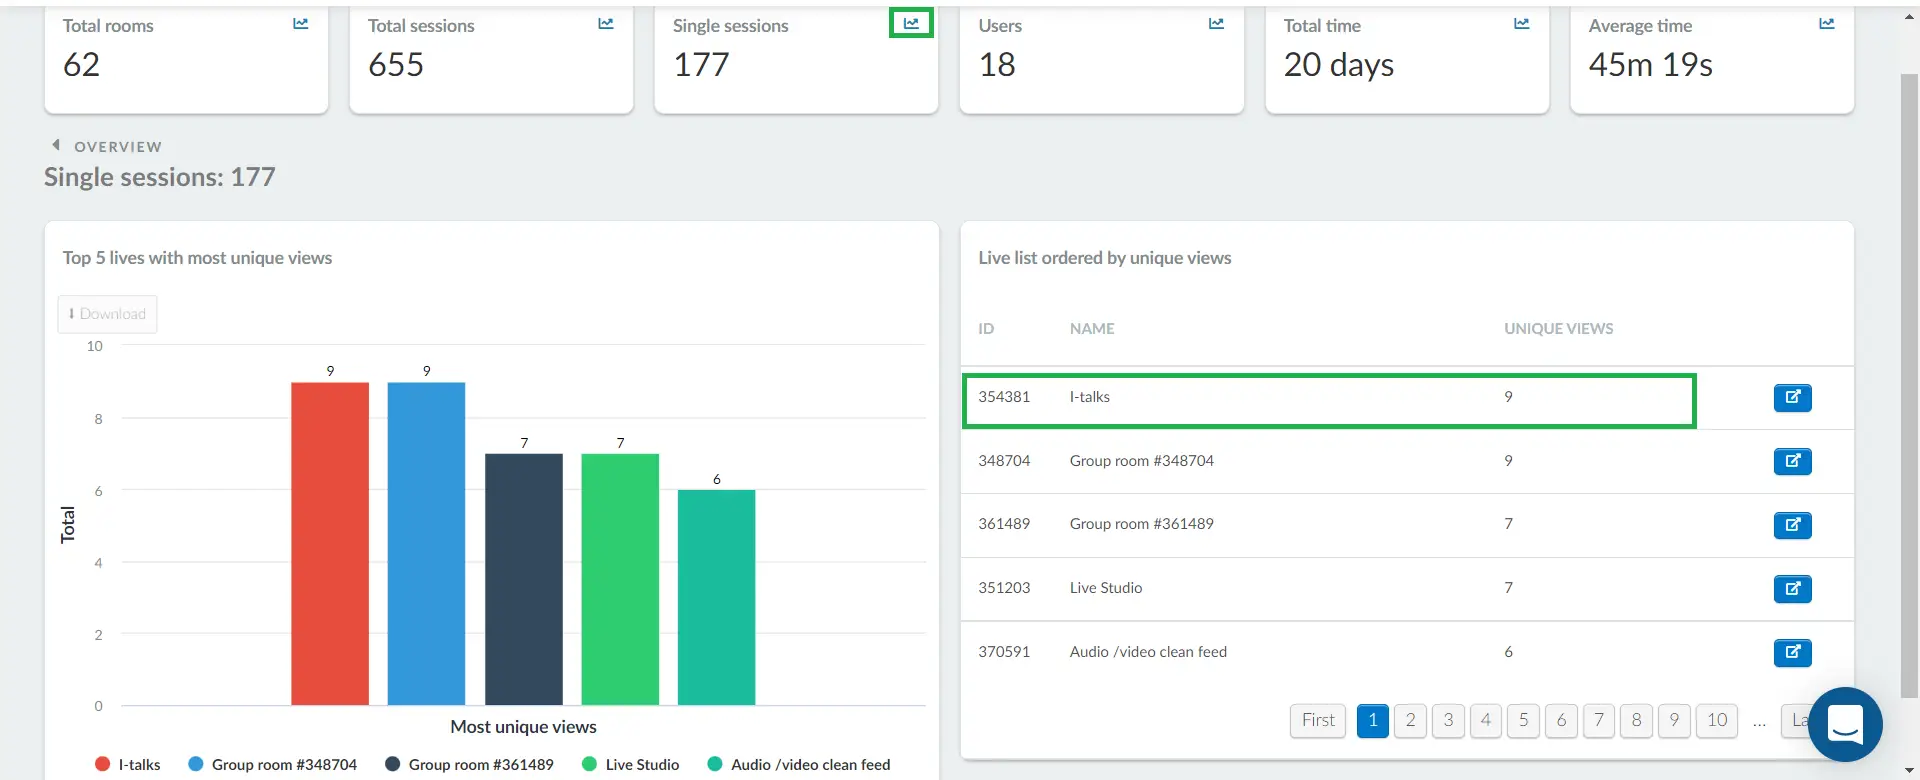
- Single sessions - Counts each person who has joined a room. If you click View on the top right corner of the box, you will see a live list ordered by unique views. For example, 9 different people have joined the I-talks session.
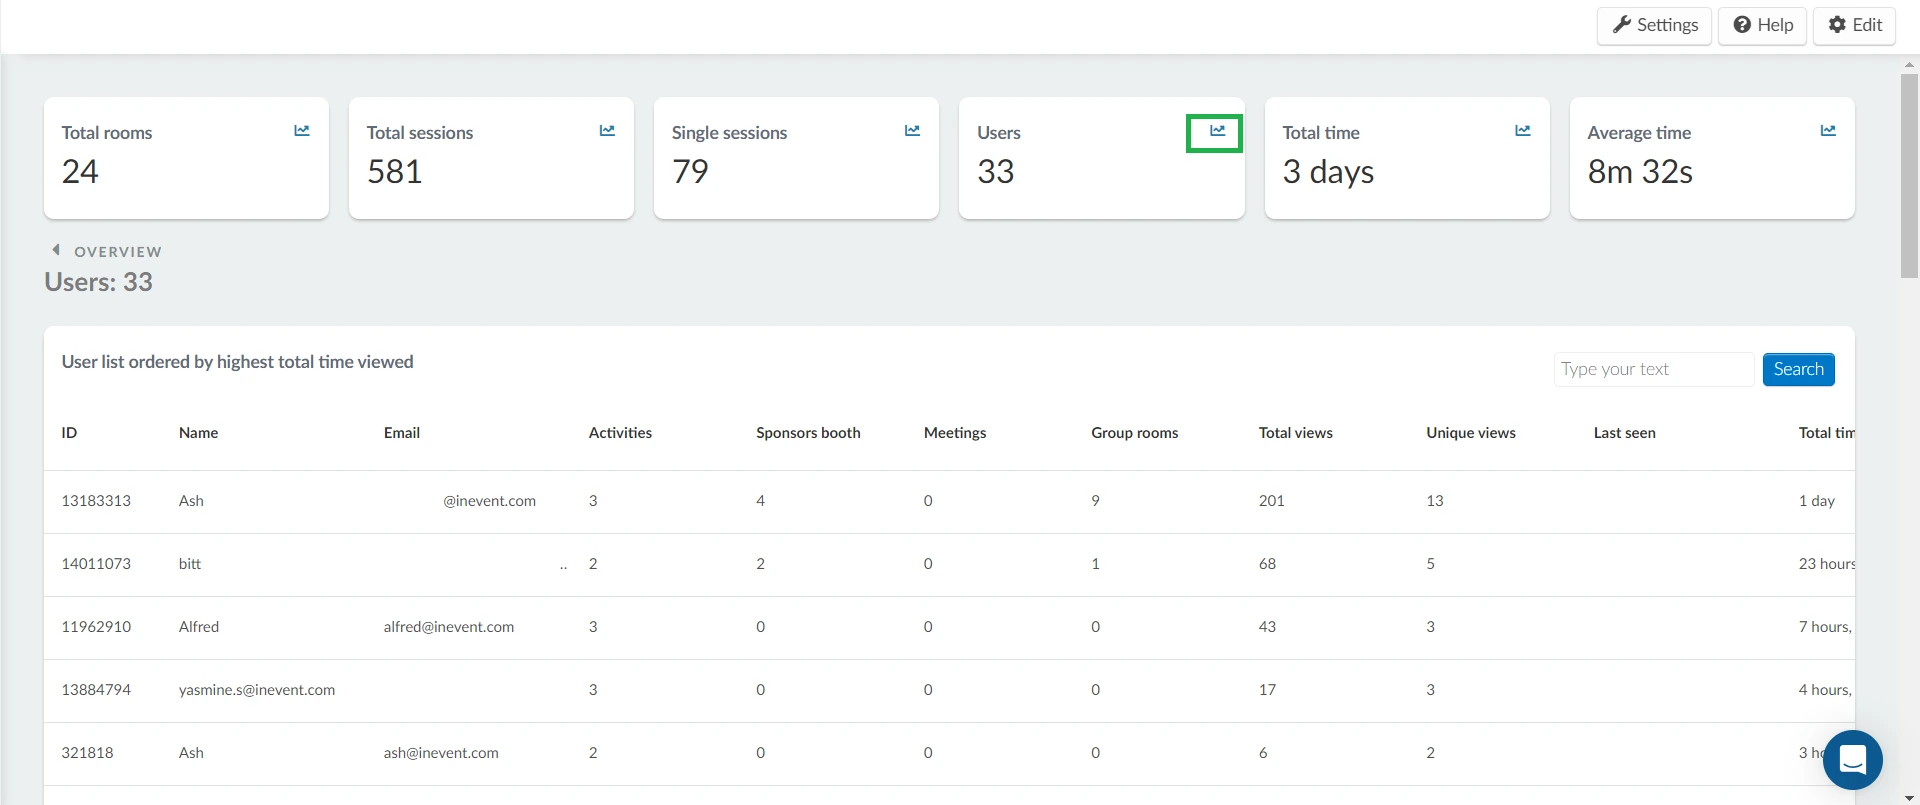
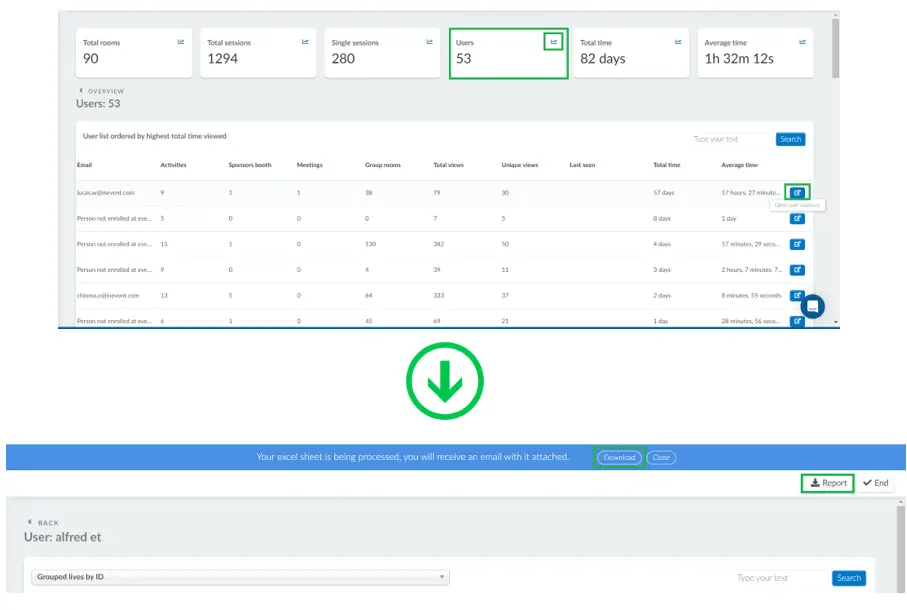
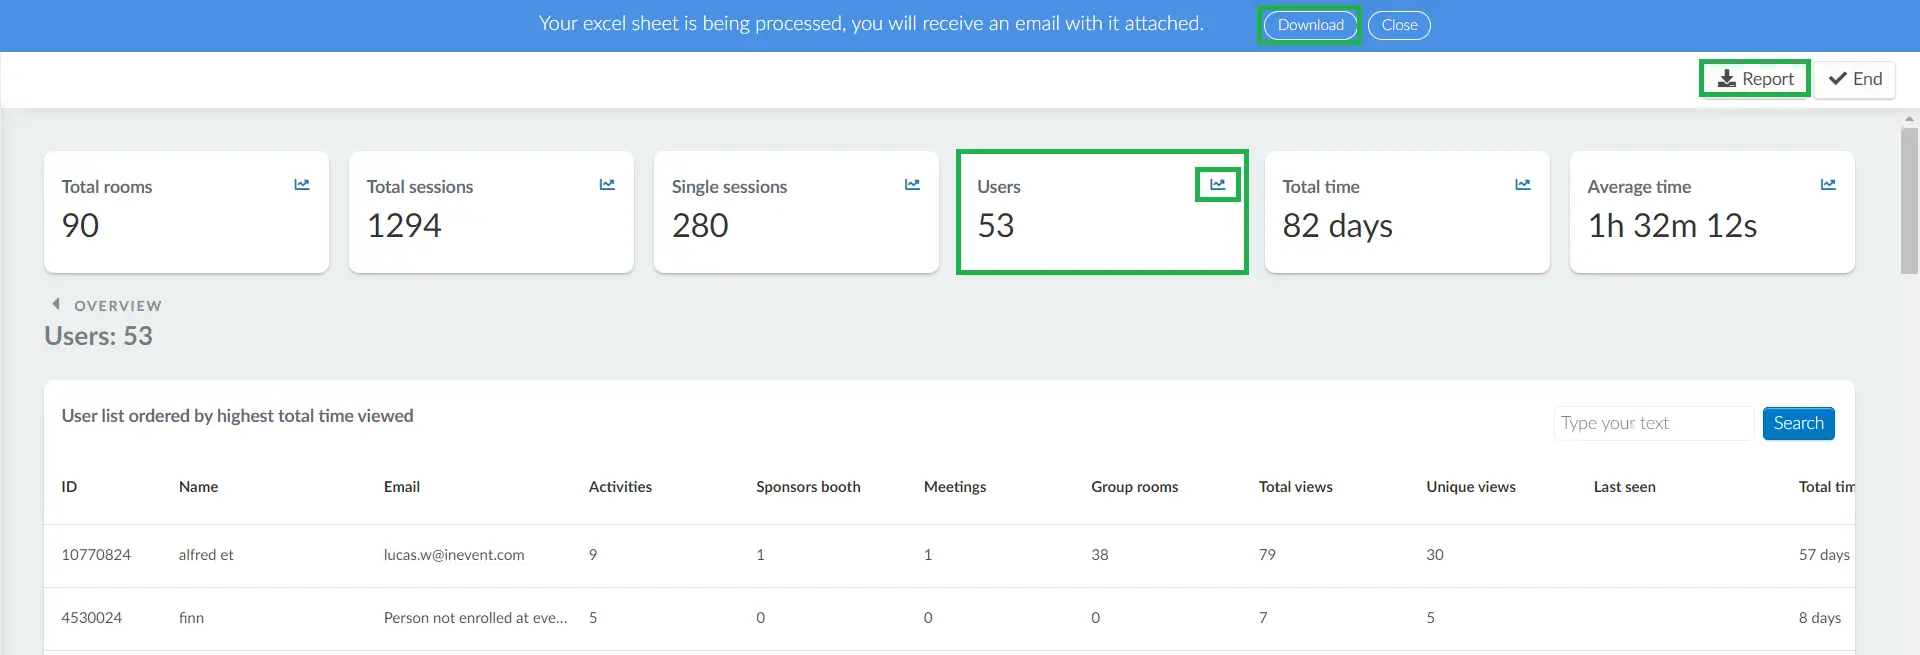
- Users - Counts how many people have joined sessions in the Virtual Lobby. By pressing the View icon at the top right corner of the box, you will see a user list ordered by highest total time viewed in the event, the number of activities, sponsors booth, meetings, and group rooms each attendee has joined, as well as total and unique views per attendee. You can click on the open user statistics button by scrolling to the right to see further performance analytics of the user in each session.
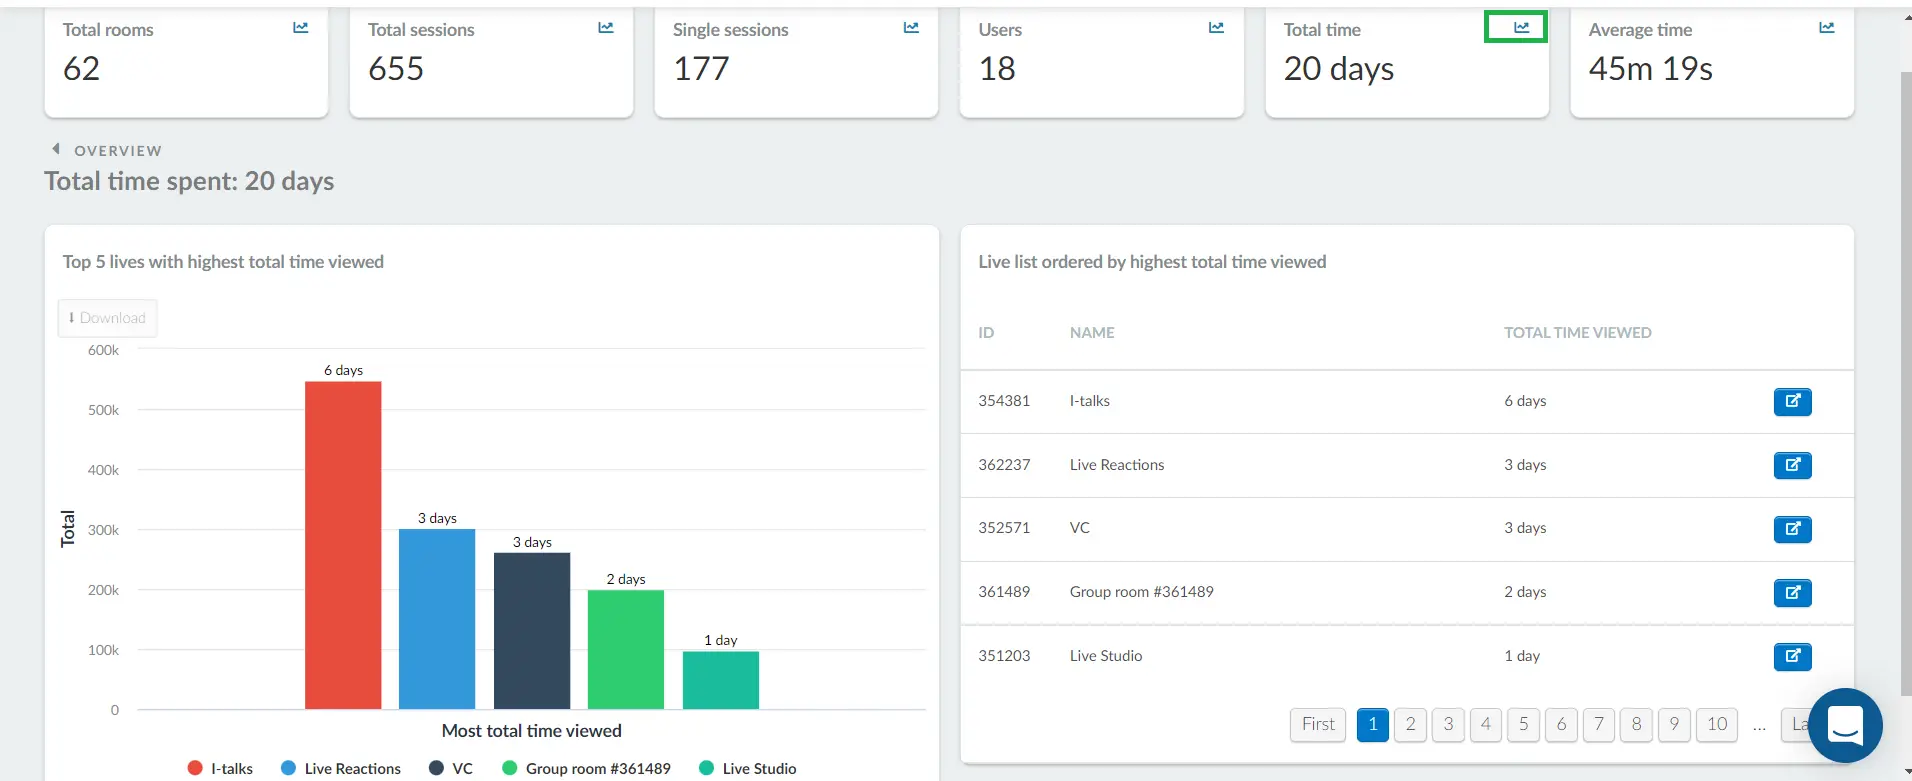
- Total Time - Total time spent by attendees in a room. By pressing View, you will see a live list ordered by the highest total time viewed per room. This time comprises the views of all attendees at the event.
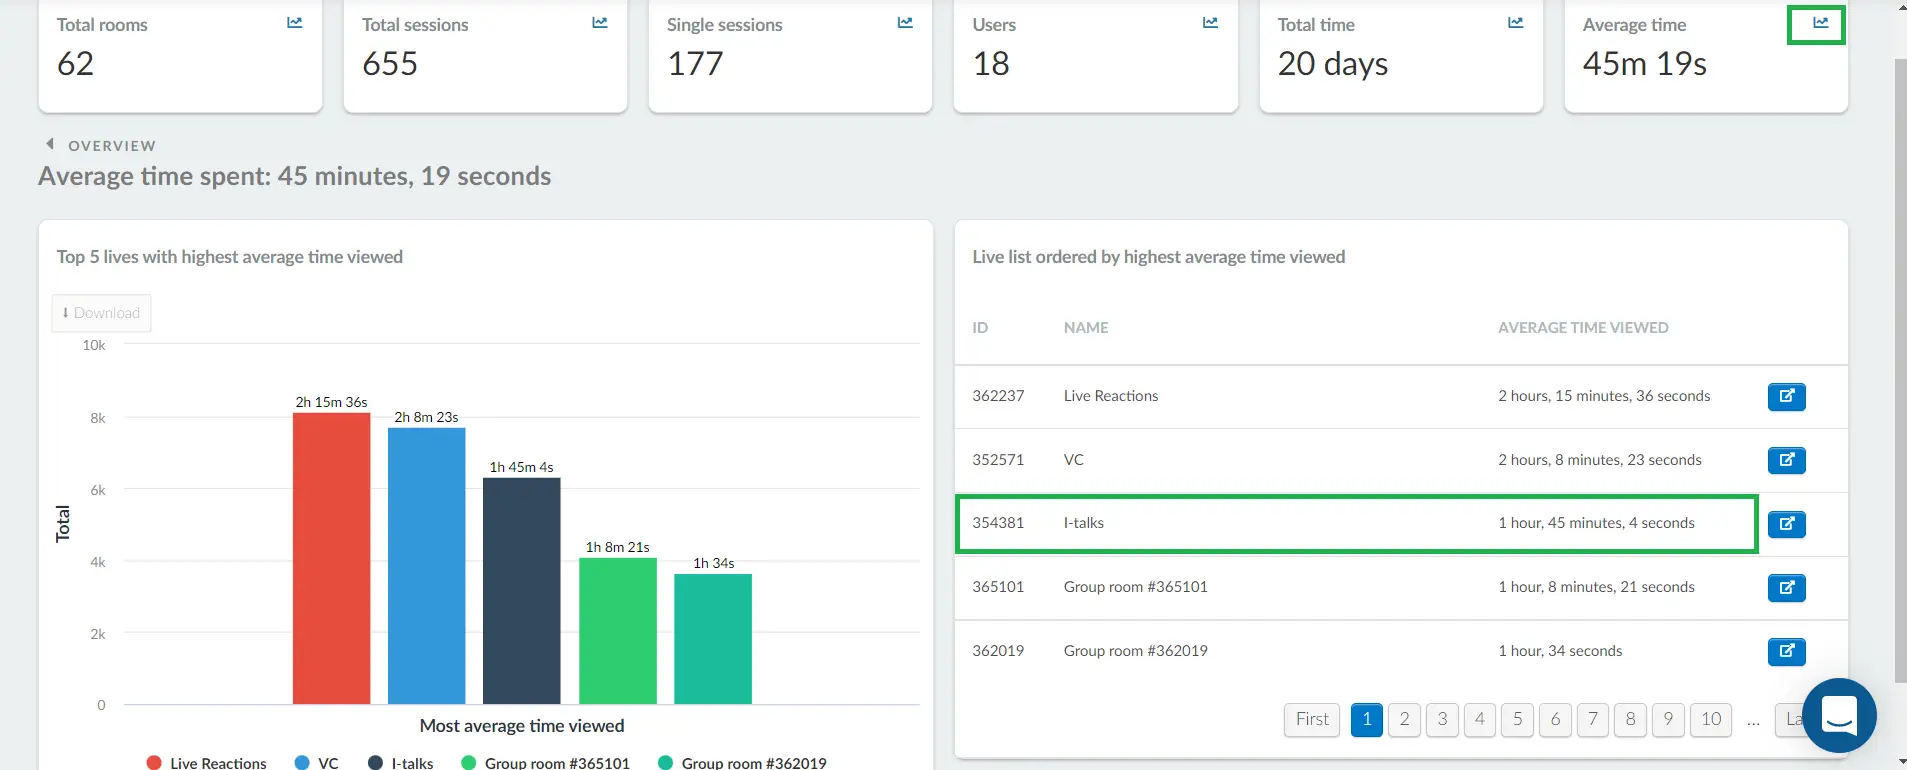
- Average Time - Average time spent by attendees in a room. By pressing View, you will see a live list ordered by the highest average time viewed per room. For example, people spend 1 hour, 45 minutes, 4 seconds on average inside the I-talks session.
Overview
Here you can find two sections: Online users over time and Live performance.
Online users over time
Timeline
This line chart will show you the number of active attendees at certain points of time throughout the event. The green line shows the number of online users and the blue line shows the number of participants inside sessions.
You can define the period to be analyzed and shown in the graph. To do this, use the buttons highlighted in green in the image below.
Map online
This map will display the users that are online at the moment in the Virtual Lobby. If you select World in the dropdown bar, you will see the top countries with the most online users. If you select United States, you will see the top states with the most online users.
Map total
This map will display every user who ever accessed your event in the Virtual Lobby regardless if they are online or offline at the moment. If you select World in the dropdown bar, you will also see the top countries with the most online users. If you select United States, you will see the top states with the most online users.
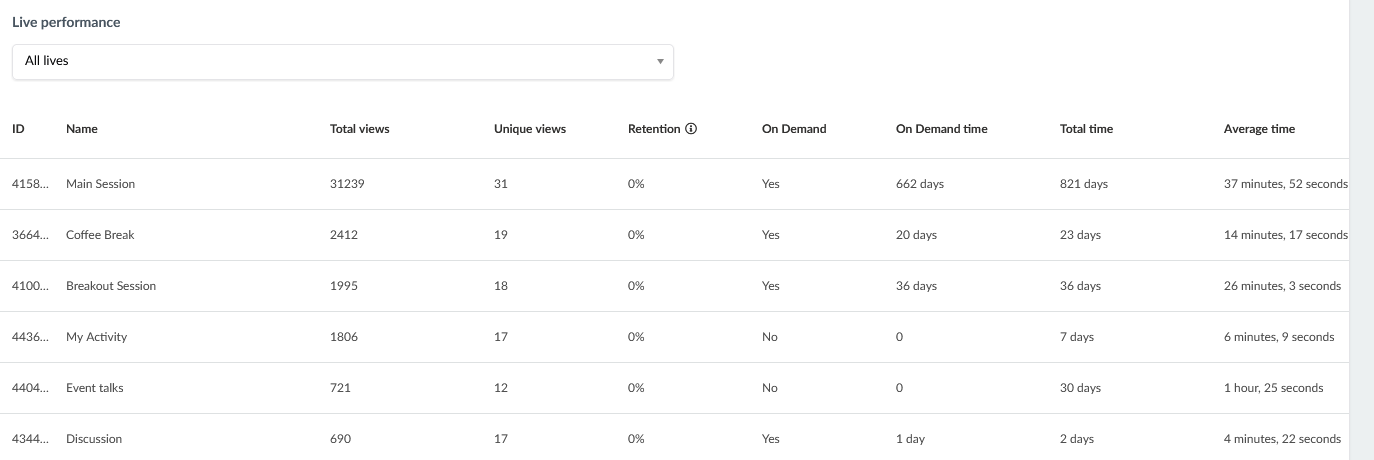
Live Performance
You can see a list of the rooms - activities, sponsor, exhibitor, group rooms, meetings created by admins and also the group rooms and meetings created by participants.
The dashboard will also display the following information:
- Total views: Counts the total amount of times people have joined the room (for example if they have entered, left, then re-entered)
- Unique views: Counts each person who has joined a room
- Retention: Shows the percentage of people that have over 70% watch time of the total activity. This percentage is calculated based on the start and end time of the activity. Retention will not be calculated for Sponsor rooms or group rooms, as these rooms are available for the entire duration of the event, so they will display a Not apply label.
- On Demand: Shows if the activity is on demand or not.
- On Demand time: Shows the runtime of the on demand activity.
- Total time: Shows the total time spent by attendees in a room.
- Average time: Shows the average time spent by attendees in a room.
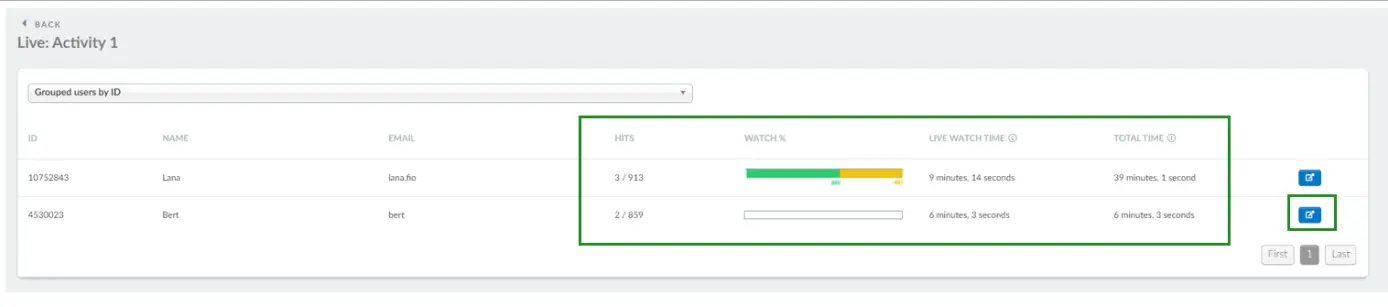
You can click on the blue button on the right of each session to break it down:
- ID, name and email of who took part in the live session.
- Hits: Number of times that a user answered the attendance tracking pop-up window. To learn more about attendance tracking refer to the Attendance tracking article.
- Watch %: The green bar corresponds to the time the user spent watching the session when it was live, within the session date & time bounds. The yellow bar refers to the time the user spent in the room before or after the session date & time.
- Live watch time: This data refers to the time the user spent watching the session when it was live, within the session date & time bounds.
- Total time: Total time spent by attendees in a room, combining both Live + On Demand.
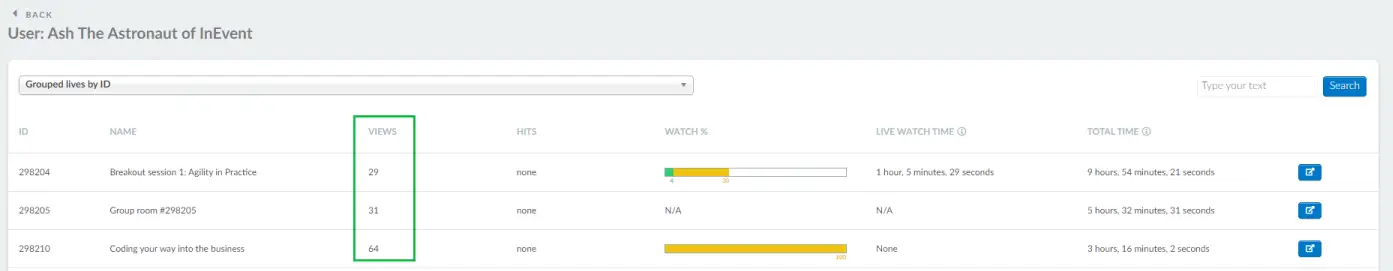
If you click the blue button again, you will see the number of times each user watched each session under the Views column.
Filters
It is possible to filter the Live Performance and have specific data for the following:
- All lives: It will display all the sessions that took place in the Virtual Lobby, including all activities, Sponsor rooms, Meetings, Group rooms, Speed Networking, and Breakout rooms.
- Activities: It shows all the activities of the event, including the ones that didn't have any viewers.
- Sponsors: It shows all the Sponsors and Exhibitors that have enabled virtual rooms.
- Meetings: In this section will be displayed all the scheduled meetings.
- Group rooms: It displays the Speed networking sessions (showing the participants' names), Breakout rooms, and Group rooms.
Grouping and ungrouping reports
You can define if you'd like to display a listing of all your reports or if you'd rather have them grouped.
Sessions
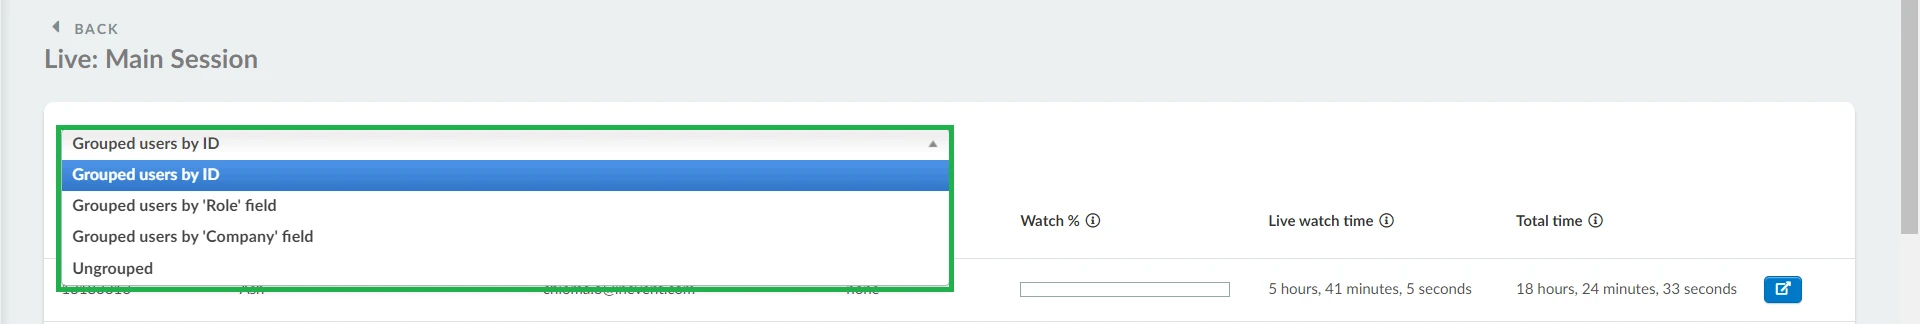
You can generate reports about who attended each session by using the filter options mentioned below:
- Grouped users by ID - ID, name, email, hits, watch%, live watch time, total time.
- Grouped users by Role field - role, total views, total time, average time.
- Grouped users by Company field - company, total views, total time, average time.
- Ungrouped - ID, name, email, watch%, live watch time, total time.
Users
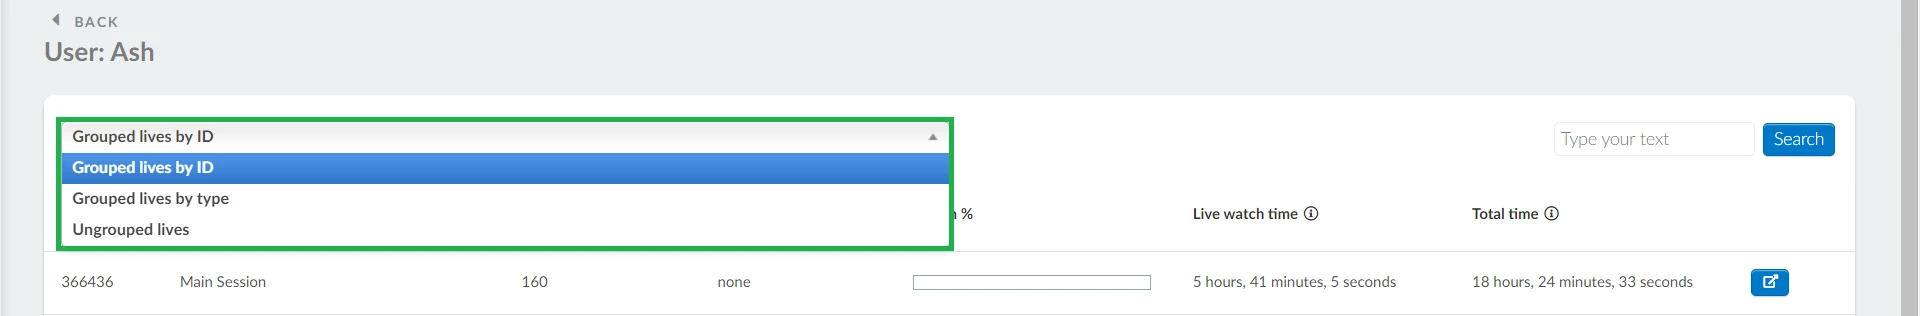
You can generate reports about which sessions each user attended by using the filter options mentioned below:
- Grouped lives by ID: ID, name, hits, watch %, live watch time, total time.
- Grouped lives by type: ID, type, views, live watch time, total time.
- Ungrouped lives: ID, name, watch %, live watch time, total time.
Extracting a report
There are different types of reports that can be generated from the Virtual Lobby Analytics page:
- Single session report
- All sessions report
- Single user report
- All users report
Single session report
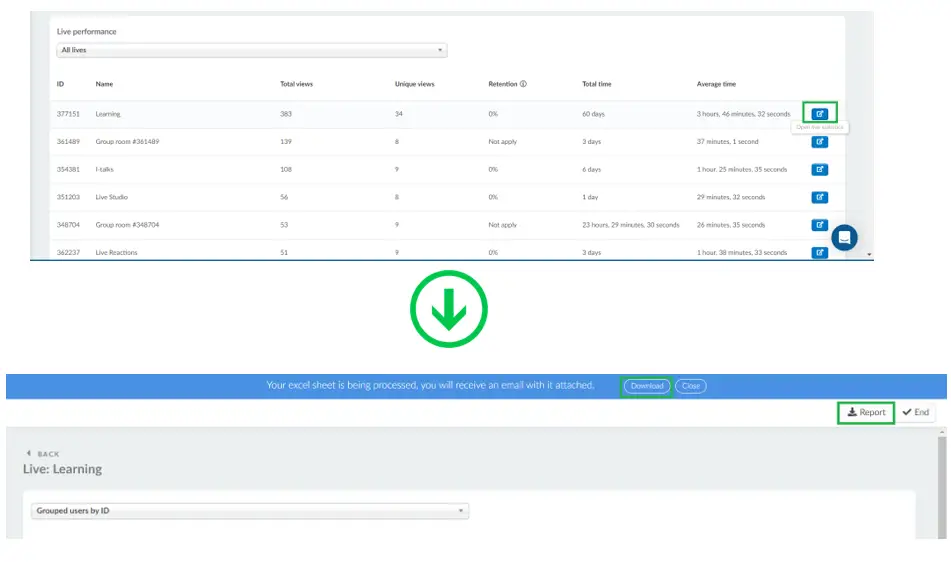
This contains reports of all attendees and their Live session logs for one session only in the Virtual Lobby. To extract a single session report, scroll down to the Live performance section, press the blue Open user statistics button beside the session you wish to extract a report for. Click on Edit > Report.
A spreadsheet containing information on the selected session will be sent to your email.
All sessions report
This contains reports of all live sessions in the Virtual Lobby. To extract a report on all your Live sessions, simply click on Edit > Report on the Virtual Lobby reports page.
A spreadsheet containing information on all Live sessions in your Virtual Lobby will be sent to your email.
Single user report
This report contains all logs of Live sessions attended by an attendee in the Virtual Lobby. To extract a report on the attendee, click on Users > locate the desired user from the list and click on the blue Open user statistics button, then press Edit > Report.
A spreadsheet containing information on all Live sessions attended by the user will be sent to your email.
All users report
This contains reports of all attendees in the Virtual Lobby. To extract a report on all your attendees, simply click on Users > Edit > Report on the Virtual Lobby reports page.
A spreadsheet containing information on all attendees in your Virtual Lobby will be sent to your email.
Analyzing the reports
Single session report
When you download the spreadsheet report of a single session, you will find the following information in the columns below:
- livePersonID: The identifier of the attendee who watched the session.
- liveID: The ID of the session itself (the one that shows up in the Virtual Lobby URL).
- personID: The ID of the attendee (the one that shows up in the backend URL).
- username: The username of the attendee.
- name: The full name of the attendee - first name and last name.
- firstName: The first name of the attendee.
- lastName: The last name of the attendee.
- email: The email address of the attendee.
- role: The role of the attendee.
- company: The company of the attendee.
- telephone: The telephone number of the attendee.
- activities: If the session type is an activity, the entry will be 1.
- meetings: If the session type is a meeting, the entry will be 1.
- sponsors: If the session type is a sponsor room, the entry will be 1.
- groupRooms: If the session type is a group room, the entry will be 1.
- totalViews: It displays the total amount of times attendees have joined the session (for example if they have entered, left, then re-entered)
- uniqueViews: It counts each attendee who has joined a room.
- sessionDuration: The duration of the session based on the start and end time.
- Date Joined: It shows the first time that the attendee entered the room.
- Date Updated: It shows the last time the attendee entered the room.
- totalTimeSpent: It shows the total time spent by an attendee in the room.
- avgTimeSpent: It shows the average time spent by an attendee in the room.
- watchTimeSpent: It corresponds to the time spent by the user watching the session when it was live, within the session date & time bounds.
- attendanceHits: Number of times that an attendee answered the attendance tracking pop-up window.
- attendancePopus: Number of attendance pop-ups that were defined by the admin.
- Feedback(s): If you have added custom questions in your registration form, each question will appear here as a column.
- FeedbackDate: The date of custom question answer submission by an attendee.
- Tags: The tags attached to an attendee.
All Sessions report
When you download the spreadsheet report of all the live sessions, you will find the following information in the columns shown below:
- eventID: The ID number of the specific event which data is being reported.
- liveID: The ID of the session itself (the one that shows up in the Virtual Lobby URL).
- activityID: The ID of the session itself (the one that shows up in the backend URL).
- livePersonID: It's the identifier of the specific watched session. Every time an attendee opens and closes a session, a new ID is generated to track how long the person stayed there.
- personID: The ID of the attendee.
- name: It displays the name of the session, group room, breakout room, meeting, etc.
- eventName: The event's name.
- eventNick: The event's nickname as it shows in the Event > Details.
- totalViews: It displays the total amount of times people have joined the room (for example if they have entered, left, then re-entered).
- uniqueViews: It counts each person who has joined a room.
- sessionDuration: The duration of the session based on the start and end time.
- Type: It shows the room type, if it's an activity, sponsor booth, meeting or group room.
- attendeeWatchAvg: This shows the average number of attendees that engaged in a session. AttendeeWatchAvg is calculated as retention (%) multiplied by the number of unique views. The result is displayed rounded to the nearest whole number.
- isOnDemand: This shows if the activity is an on demand activity. If it is an on demand activity, it will show 1.
- totalTimeOnDemand: This shows the total time spent watching the On demand activity.
- Date Joined: It shows the first time that an attendee user entered a room.
- Date Updated: It shows the last time that an attendee entered a room.
- totalTimeSpent: It shows the total time spent by attendees in a room.
- avgTimeSpent: It shows the average time spent by attendees in a room.
- watchTimeSpent: It corresponds to the time spent by users watching the session when it was live, within the session date & time bounds.
- watchedLive: This shows if the attendee watched the session live. The number 1 will appear in the field if they attendee did, otherwise it will stay blank.
- watchedOnDemand: This shows if the attendee watched the session on demand. The number 1 will appear in the field if the attendee did, otherwise it will stay blank.
- attendanceHits: Number of times that a user answered the attendance tracking pop-up window.
- attendancePopups: Number of attendance pop-ups that were defined by the admin.
- retentionRate: It displays the percentage of people that have over 70% of watch time. Applicable only in activity rooms.
Single user report
When you download the spreadsheet report of a single user, you will find the following information in the columns below:
- eventID: The ID number of the specific event which data is being reported.
- liveID: The ID of the session itself (the one that shows up in the Virtual Lobby URL).
- activityID: The ID of the session itself (the one that shows up in the backend URL).
- livePersonID: It's the ID of the specific watched session. Every time an attendee opens and closes a session, a new ID is generated to track how long the person stayed there.
- personID: The ID of the attendee (the one that shows up in the backend URL) in the People > Attendees page.
- personName: The full name of the attendee.
- name: It displays the name of the session, group room, breakout room, meeting, etc.
- companyName: The company of the attendee.
- eventName: The event's name.
- eventNick: The event's nickname as it shows in the Event > Details.
- totalViews: It displays the total amount of time the attendee joined the live session (for example if they have entered, left, then re-entered).
- uniqueViews: It counts each person who has joined a room.
- sessionDuration: The duration of the session based on the start and end time.
- Type: It shows the room type, if it's an activity, sponsor booth, meeting or group room.
- attendeeWatchAvg: This shows the average number of attendees that engaged in a session. AttendeeWatchAvg is calculated as retention (%) multiplied by the number of unique views. The result is displayed rounded to the nearest whole number.
- isOnDemand: This shows if the activity is an on demand activity. If it is an on demand activity, it will show 1.
- totalTimeOnDemand: This shows the total time spent watching the On demand activity.
- Date Joined: It shows the first time that the attendee entered a room.
- Date Updated: It shows the last time the attendee entered a room.
- totalTimeSpent: It shows the total time spent by the attendee in a room.
- avgTimeSpent: It shows the average time spent by the attendee in a room.
- watchTimeSpent: It corresponds to the time the attendee spent watching the session when it was live, within the session date & time bounds.
- attendanceHits: Number of times that a user answered the attendance tracking pop-up window.
- attendancePopups: Number of attendance pop-ups that were defined by the admin in a session.
- retentionRate: It displays if the attendee's watch time percentage is over 70%. Applicable only in activity rooms.
All users report
When you download the spreadsheet report of all users, you will find the following information in the columns below:
- livePersonID: It's the ID of the specific watched session. Every time an attendee opens and closes a session, a new ID is generated to track how long the person stayed there.
- liveID: The ID of the session itself (the one that shows up in the Virtual Lobby URL).
- personID: The ID of the attendee (the one that shows up in the backend URL) in the People > Attendees page.
- username: The username of the attendees.
- name: The full name of the attendees - first name and last name.
- firstName: The first name of the attendees.
- lastName: The last name of the attendees.
- email: The email address of the attendees.
- role: The roles of the attendees.
- company: The companies of the attendees.
- telephone: The telephone numbers of the attendees.
- activities: The number of activities attended by each attendee.
- meetings: The number of meetings attended by each attendee.
- sponsors: The number of sponsor rooms attended by each attendee.
- groupRooms: The number of group rooms attended by each attendee.
- totalViews: It displays the total amount of times attendees have joined all sessions.
- uniqueViews: It counts all the attendees that have joined a session.
- sessionDuration: It shows the summed up duration of all sessions each user joined based on their start and end times.
- Date Joined: It shows the time that each attendee entered their first session.
- Date Updated: It shows the time that each attendee entered their last session.
- totalTimeSpent: It sums the total time spent by each attendee in all the sessions.
- avgTimeSpent: It shows the average time spent by an attendee in all the sessions.
- attendanceHits: It shows the number of times that each user answered the attendance tracking pop-up window.
- attendancePopus: It shows the number of attendance pop-ups that were defined by the admin.
- Feedback(s): If you have added custom questions in your registration form, each question will appear here as a column.
- FeedbackDate: The date of custom question answer submission from each attendee.
- Tags: The tags attached to each attendee.