Analytics: Viewing and extracting event reports?
Track various types of information and controls in real-time. This feature presents a variety of information so that you can carry out your decision-making and process improvement. This functionality also makes it possible to analyze ROI, post-event information, and more!
The Analytics Menu
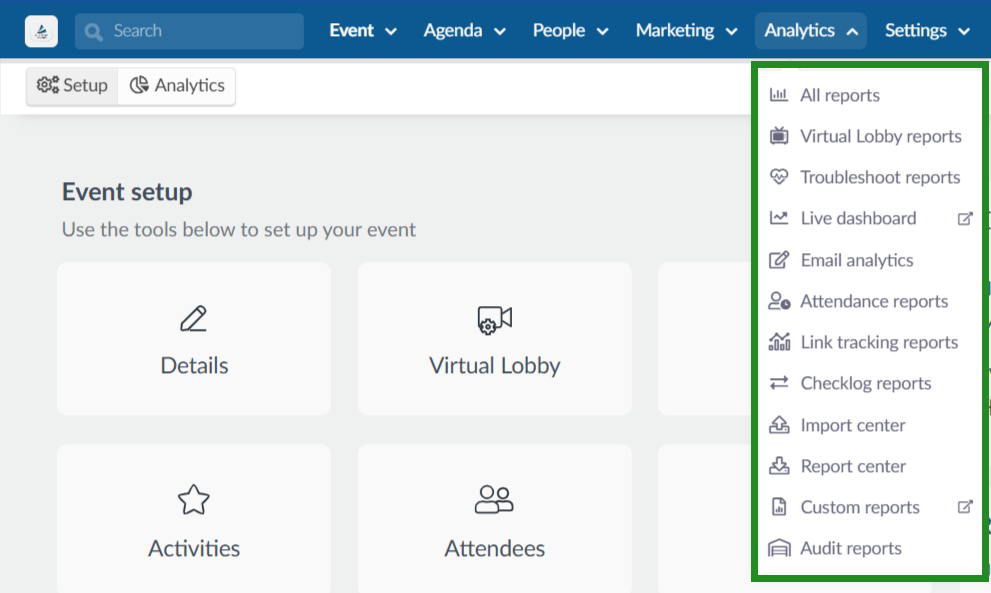
The Analytics menu includes:
- All reports: Collates all the analytical reports from different pages of the platform;
- Virtual Lobby reports: Includes data such as who joined each room and for how long;
- Troubleshoot reports: Includes the troubleshoot reports raised by attendees from the Virtual Lobby;
- Live dashboard: Provides reports on interactions including data from both the Virtual Lobby and the mobile app;
- Email analytics: You'll be able to check how many emails have been sent out, the delivery rate, the open rate, and the bounce rate as well;
- Attendance reports: You will be able to verify the computed credits for each user or session;
- Link tracking reports: You will be able to track the performance of campaigns and content;
- Checklog reports: The logs will contain the check-in & check-out times and dates of your attendees;
- Import center: Includes records of imported data and any import error messages;
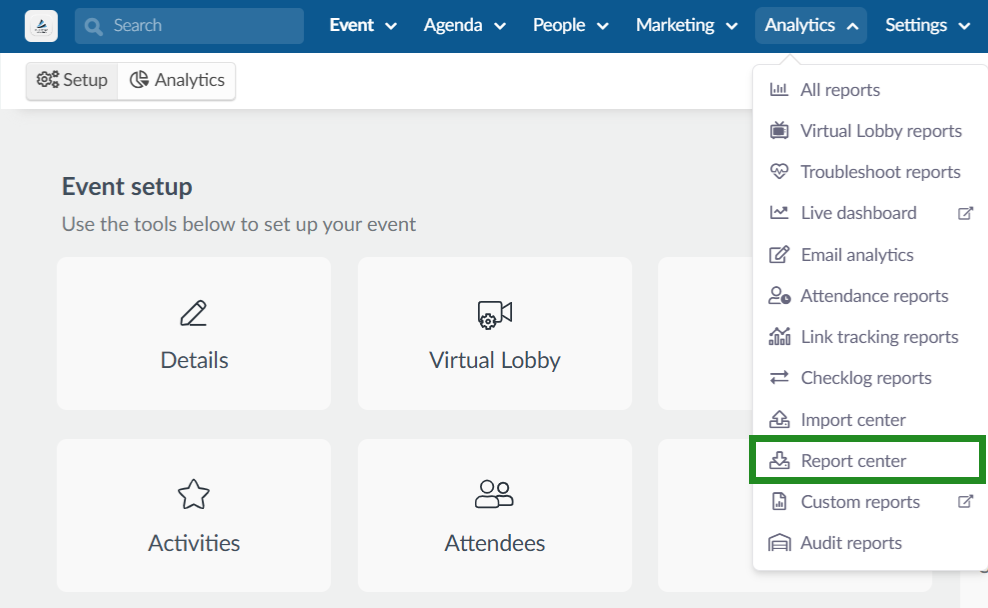
- Report center: Includes a record of all requested report downloads;
- Custom reports: It will allow you to select different sources of information to create customized reports for your event;
- Audit reports: It will allow you to see a timeline of data changes that have been made in your company's account.

How do I extract reports from the platform?
There are two ways to extract reports from the InEvent platform:
- Clicking the Report button (when apparent).
- Clicking the Edit > Report
Once you click the button, a message will appear at the top of the screen, warning you that you will receive the file with the data in your email when the process is complete.

Filter and search
To extract more concise reports, you can apply filters and perform research before clicking the download button.

Below are a few examples of situations when the filter functionality may be used:
- Managing attendees on the Attendee's page or on the All Leads page
- Generating email health reports
- Managing payments
- Analyzing the registration form submissions
Report center
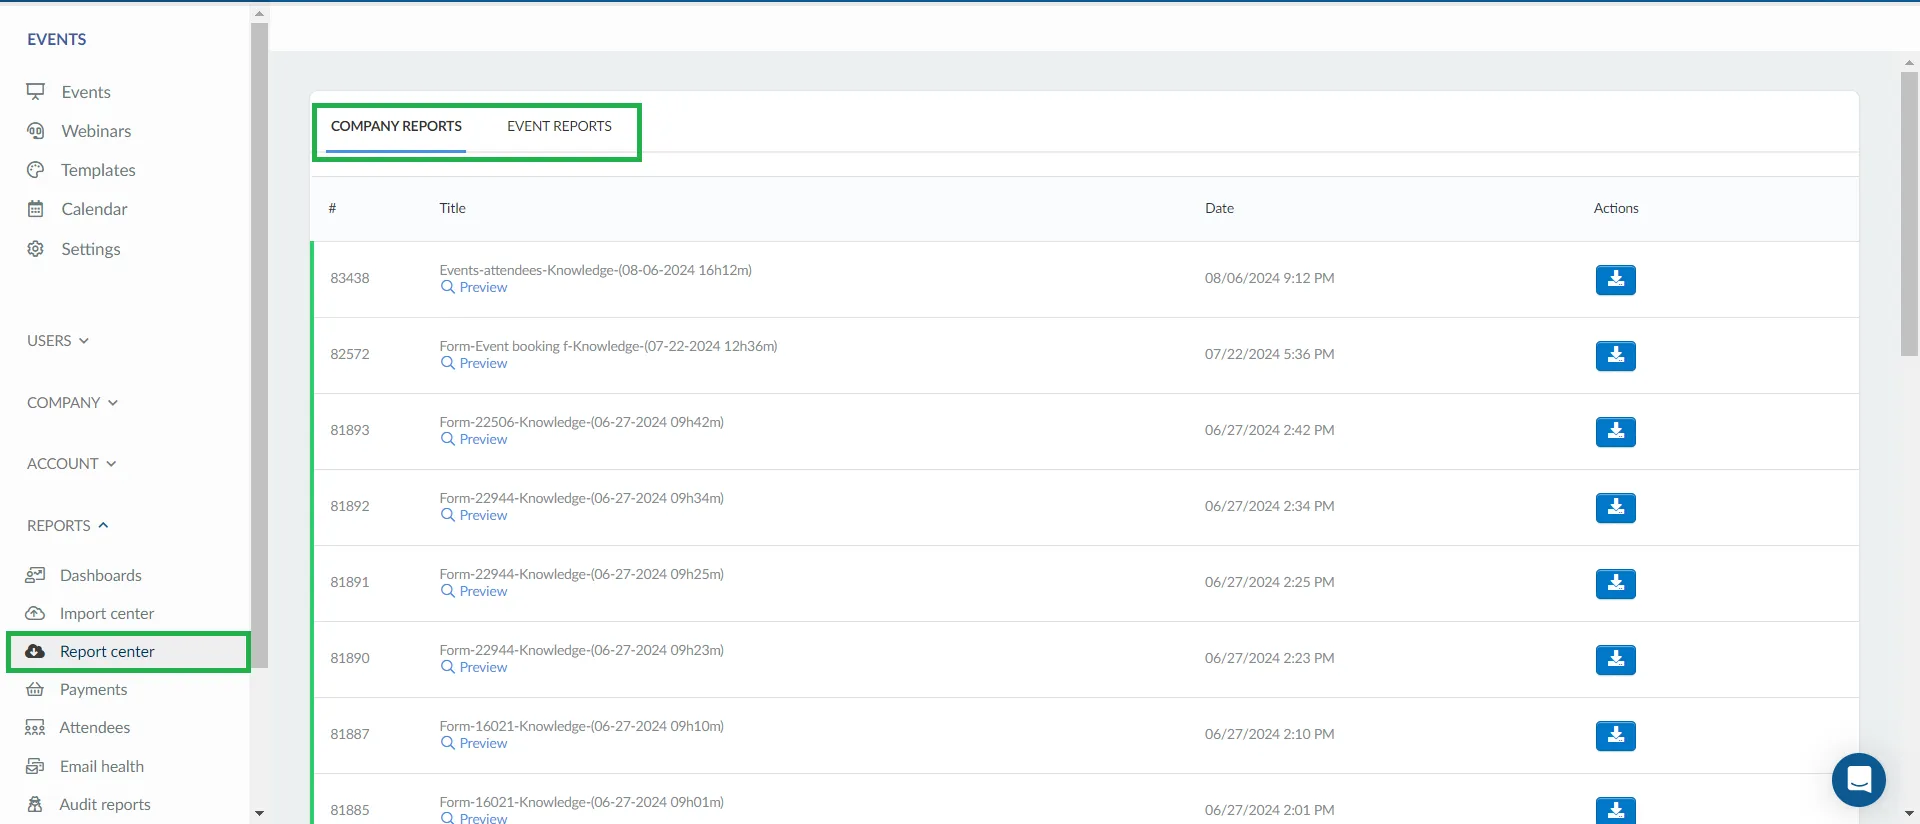
All reports already extracted are stored in the platform's report center at the event level and company level.
You can access this page from the event level by clicking on Analytics > Report Center. This will display reports within the event.

You can also access the page from the company level, by clicking on Reports > Report center. At the company level, the Report center will show reports triggered at the company level and also reports made at event level.
All export logs will be displayed following the order newest to oldest.
To download the spreadsheet, you must search for the latest spreadsheet of the event that was requested to export. To download a spreadsheet with the reports, click on the blue button in the Actions column.

What reports can I extract?
- Event full report: You can extract a report that gives you information from multiple event modules. Click here for further information.
- All event leads: you can generate a complete report of all people at the event by extracting an excel with a column that brings together all types of people (guests, waiting list, attendees) and their responses from the registration form, if any.
- Guests: you can generate RSVP Reports by extracting full excel sheets and seeing all the answers to RSVP. Responses from the application form will also be displayed.
- Waitlist: you can generate an event Pre-Registration Report to see all people who have expressed interest in your event but have not confirmed yet.
- Forms: you can see all form Responses (signup and custom). In addition to extracting the report, you can view your form data on the platform itself.
- Participants: you can generate reports from all participants and extract all your confirmed data into one spreadsheet.
- Virtual Lobby: you can generate reports of who joined each room and for how long.
- Email analytics: you'll be able to check how many emails have been sent out, the delivery rate, the open rate, and the bounce rate as well. Click here for further information.
- Feed posts: you can extract reports from all images, videos, posts, and see the number of likes and comments on each one. In the dashboard, you will see the most engaged posts automatically.
- Feedback: you can extract reports from the event or activity's feedback.
- Interactions: you can generate reports for questions, chat, and files.
- Sponsorship and Exhibitor reports: you can extract data from sponsor and exhibitor rooms and sponsored activities visits, file clicks, sponsored ads reports, leads collection, and live chat engagement. Click here for further information.
- Event schedule: you can export the list of activities on the calendar and extract numbers of subscribers by activity and start and end times, among other information, from your event schedule.
- Ticket management: you can extract the total ticket list, the unfinished ticket purchase list, the ticket payment list, and also the discount coupon list.
- Leads collection: you can generate sponsor collector reports and extract them one by one or grant your sponsors specific permission to extract their own reports.

